4.16 Charge decomposition analysis and plotting orbital interaction diagram
Note
Chinese of this section is my blog article “Using Multiwfn to perform charge decomposition analysis (CDA) and plotting orbital interaction diagram” (http://sobereva.com/166, in Chinese), which also contains more discussions.
The theory of charge decomposition analysis (CDA), extended CDA (ECDA) and generalized CDA (GCDA, J. Adv. Phys. Chem., 4, 111-124 (2015) DOI: 10.12677/JAPC.2015.44013), as well as usage of CDA module, have been detailedly introduced in Section 3.19. In this section I will present several practical examples.
The CDA module supports .fch, .mwfn, .molden, GAMESS-US output file (.gms) and Gaussian output file as input. In the next several sections only Gaussian .fch files will be used to exemplify the usage of the CDA module.
4.16.1 Closed-shell interaction case: COBH3
In COBH3, CO makes use of its lone pair to form coordinate bond with BH3, which is an electron-deficient system (Lewis acid). Therefore, electrons will transfer from CO to BH3 during the formation of the complex. In this example we will employ CDA scheme to provide a deeper insight into the electron transfer.
First, we generate Gaussian output file for CO (fragment 1), BH3 (fragment 2) and COBH3 (complex). The .fch files and corresponding input files have been provided in "examples\CDA\COBH3" folder. The calculations were performed at HF/6-31G* level. On how to prepare the input files for CDA, see Section 3.19.2 for detail
Now boot up Multiwfn, and input following contents:
examples\CDA\COBH3\COBH3.fch // Gaussian .fch file of the complex
16 // Enter CDA module
2 // We define two fragments
examples\CDA\COBH3\CO.fch // Gaussian .fch file of fragment 1
examples\CDA\COBH3\BH3.fch // Gaussian .fch file of fragment 2
Immediately, below CDA result are outputted on screen
   Orb.      Occ.          d           b        d - b          r
      1    2.000000   -0.000004   -0.000000   -0.000004   -0.000001
      2    2.000000    0.001119   -0.000023    0.001141    0.000326
      3    2.000000   -0.000002   -0.000471    0.000469    0.000313
      4    2.000000   -0.013250   -0.000704   -0.012546   -0.005676
      5    2.000000    0.041648   -0.003309    0.044957    0.232262
      6    2.000000    0.037385   -0.020136    0.057521    0.212422
      7    2.000000   -0.000543    0.000647   -0.001190    0.022166
      8    2.000000   -0.000543    0.000647   -0.001190    0.022166
      9    2.000000    0.171353    0.026952    0.144401   -0.741381
     10    2.000000   -0.000569    0.043713   -0.044281   -0.038916
     11    2.000000   -0.000569    0.043713   -0.044282   -0.038916
     12    0.000000    0.000000    0.000000    0.000000    0.000000
     13    0.000000    0.000000    0.000000    0.000000    0.000000
     14    0.000000    0.000000    0.000000    0.000000    0.000000
     15    0.000000    0.000000    0.000000    0.000000    0.000000
 ......
-------------------------------------------------------------------
Sum:      22.000000    0.236023    0.091027    0.144996   -0.335233
"Orb." denotes the indices of the orbitals of the complex; "occ." is corresponding occupation number. "d(i)" stands for the amount of donated electrons from fragment 1 to 2 via corresponding complex orbital, "b(i)" stands for the amount of electrons back donated from fragment 2 to 1 via corresponding complex orbital. "r(i)" corresponds to the overlap population between the occupied fragment orbitals (FOs) of the two fragments in corresponding complex orbital; its positive and negative signs imply that in this complex orbital, the electrons of occupied FOs are accumulated to and depleted (mainly due to Pauli repulsion) from the overlap region between the two fragments, respectively. The sum of r(i), namely -0.335, reveals that repulsive effect dominates the overall interaction between occupied FOs, which results in corresponding electrons moved away towards non-overlapping regions from overlap regions.
The difference between d(i) and b(i), to some extent can be viewed as the number of net-transferred electrons from fragment 1 to 2 due to formation of corresponding complex orbital. But bear in mind, electron polarization effect is also included in this value.
From the data, it can be seen that the first three complex orbitals have almost zero b, d and r values, this is because they are core orbitals of O, C and B, respectively, and hence it can be expected that they are not involved in bond formation. The virtual complex orbitals have exactly zero b, d and r terms, since their occupation numbers are exactly zero. Orbital 9 leads 0.171 electrons donate from CO to BH3, which is the primary source of the donor-acceptor bonding, and causes as high as 0.741 electrons removed from overlap region between CO and BH3, which stabilized the complex by diminishing electron repulsion. Orbital 5 and 6 have small contributions to electron donation, meanwhile lead evident accumulation of electrons from respective occupied FOs to the overlap region, which must be beneficial to the bonding between the two fragments. Orbital 10 and 11 are π orbitals and degenerate in energy, they exhibit π-back donation characteristics.
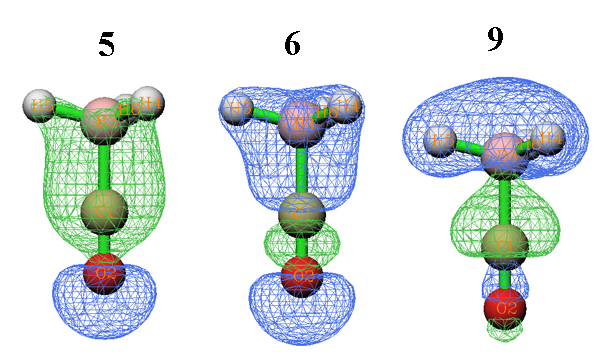
Isosurfaces of orbital 9, 5 and 6 are shown below. As you can see, a node occurs in the overlap region between CO and BH3 in orbital 9, while the isosurfaces of orbital 5 and 6 uniformly cover the overlap region. These observations largely explain why r(9) is a large negative value, and r(5) and r(6) are obvious positive values.
Notice that the definition of CDA used in Multiwfn is a generalized version proposed by me, so that CDA is also applicable to post-HF and open-shell circumstances, see corresponding part of Section 3.19.1 for detail. For the cases when original CDA is applicable (namely MO for FO, MO or natural orbital for complex orbital), the d and b terms produced by generalized CDA are exactly identical to the ones produced by original definition, while the r term is exactly twice of the one produced by original definition.
Note
The COBH3 example was also given in original paper of CDA, in which, although the formulae of d, b and r are correct, the data in their examples are incorrect: all of the data should be divided by two. I also found that all of the results of the CDA program written by Dapprich and Frenking, and the results of AOMix program should be divided by two. So, if you want to compare the CDA results calculated by Multiwfn with theirs, the d and b terms should be multiplied by two first. But do not do this for r term, since the r term computed by Multiwfn has already been doubled with respect to its original definition.
The amount of net electron transfer between the two fragments can be characterized by the b-d term, however it was argued that ECDA is a more reasonably method to calculate the amount of net electron transfer, since the contribution of electron polarization effect (PL) is completely excluded. ECDA result is outputted after CDA result:
     ========== Extended Charge decomposition analysis (ECDA) ==========
  Contribution to all occupied complex orbital:
Occupied, virtual orbitals of fragment  1:     680.4194%         8.0593%
Occupied, virtual orbitals of fragment  2:     390.3988%        21.1226%
  Contribution to all virtual complex orbital:
Occupied, virtual orbitals of fragment  1:      19.5806%      2291.9407%
Occupied, virtual orbitals of fragment  2:       9.6012%      1678.8774%
PL( 1) + CT( 1-> 2) =    0.3916      PL( 1) + CT( 2-> 1) =    0.1612
PL( 2) + CT( 1-> 2) =    0.4225      PL( 2) + CT( 2-> 1) =    0.1920
The net electrons obtained by frag. 2 = CT( 1-> 2) - CT( 2-> 1) =    0.2304
Commonly, you only need to pay attention to the last line. The data shows that the net number of electrons transferred from fragment 1 to 2 is 0.2304.
In the menu that appears on screen, by using option 2, composition of FOs in a specific complex orbital can be outputted. Here we select this option and input 9, the composition of complex orbital 9 are shown below
Occupation number of orbital     9 of the complex:  2.00000000
Orbital     7 of fragment  1, Occ: 2.00000    Contribution:   25.8560%
Orbital    13 of fragment  1, Occ: 0.00000    Contribution:    1.0798%
Orbital     2 of fragment  2, Occ: 2.00000    Contribution:   57.2921%
Orbital     5 of fragment  2, Occ: 0.00000    Contribution:   14.5640%
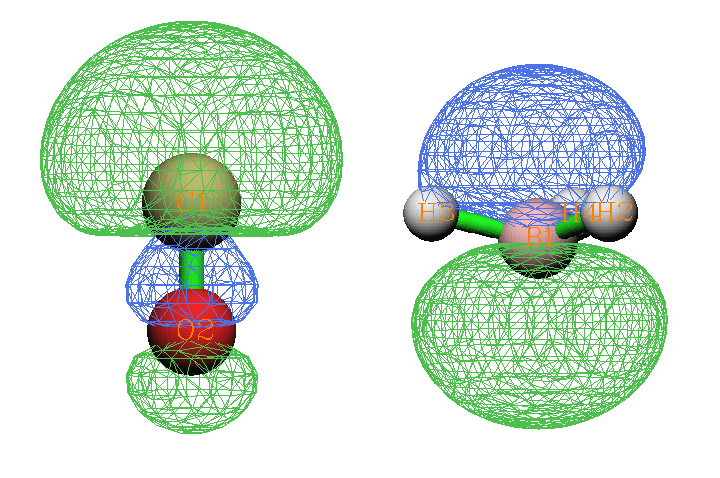
Only the FOs with contribution ≥ 1% to the complex orbital are shown (the threshold can be altered by "compthresCDA" in settings.ini). As already mentioned, the electron transfer from CO to BH3 is mainly due to the complex orbital 9, therefore from above data we can infer that the nature of the CO→BH3 electron transfer can be largely interpreted as the mix between FO 7 of CO (an occupied orbital) and FO 5 of BH3 (a virtual orbital). This viewpoint can also be manifested by comparing the shape of the two FOs (see below) with the shape of complex orbital 9 given above.
Note
Sometimes a few contributions of FOs may be negative, this is a well-known drawback of Mulliken analysis, which is the method employed in CDA module to calculate the complex orbital composition. Since the magnitudes of the negative values are often small, you can simply ignore them.
We can also directly decompose d, b, r terms of a complex orbital to FO pair contributions, let us do this for complex orbital 9. Now input 0 to return to the last menu, select option 6 and input 9, then input a threshold e.g. 0.005, then all FO pairs whose contribution to any of d, b, r term larger than 0.005 are printed:
FragA Orb(Occ.)  FragB Orb(Occ.)      d           b        d - b          r
   4( 2.0000)       2( 2.0000)    0.000000    0.000000    0.000000   -0.009969
   7( 2.0000)       1( 2.0000)    0.000000    0.000000    0.000000   -0.005759
   7( 2.0000)       2( 2.0000)    0.000000    0.000000    0.000000   -0.723845
   7( 2.0000)       5( 0.0000)    0.176503    0.000000    0.176503    0.000000
   7( 2.0000)       8( 0.0000)    0.006221    0.000000    0.006221    0.000000
   7( 2.0000)      11( 0.0000)    0.005846    0.000000    0.005846    0.000000
   7( 2.0000)      12( 0.0000)   -0.023941    0.000000   -0.023941    0.000000
  13( 0.0000)       2( 2.0000)    0.000000    0.021958   -0.021958    0.000000
From the output it is clear that the mix between FO 7 of CO and FO 5 of BH3 contributes most of the d term of complex orbital 9.
Finally, we plot orbital interaction diagram. Input 0 to return to the last menu, and then select 5 to enter the menu for plotting orbital interaction diagram. Choose option 3 and input -30,10 to set lower and upper energy limits of the plot to -30eV and 10eV, respectively. Then select option 1 to plot the diagram under default settings, a graph will pop up on screen:
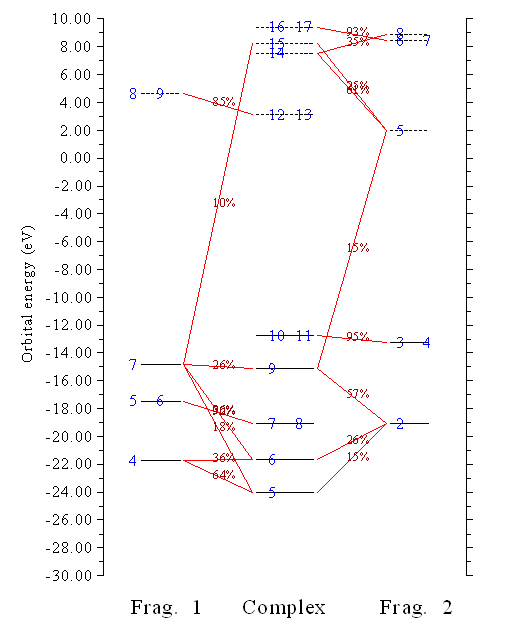
In the graph above, occupied and virtual orbitals are represented as solid and dashed bars, respectively. Orbital indices are labelled by blue texts. If two or more labels occur in the same bar, e.g. 7 and 8, that means these orbitals are degenerated in energy. If composition of a FO in a complex orbital is larger than 10%, then the corresponding two bars will be linked by red line, and the composition will be labelled on the lines. By simply viewing the diagram we can directly understand how the MOs of COBH3 are constructed by FOs of CO and BH3. For example, complex orbitals 7 and 8 only link to FO 5 and 6 of CO in this diagram, hence we immediately know that these two orbitals basically remain unperturbed during formation of the complex. In fact, they are π orbitals of CO, certainly they cannot participate to the σ type donor-acceptor interaction between CO and BH3.
There are many options used to adjust plotting parameters (such as label size, the rule for drawing and linking bars, position of composition labels, energy range), please play with them, and replot the graph to check their effects.
4.16.2 Open-shell interaction case: CH3NH2
In this example, I use CH3NH2 to illustrate how to perform CDA for the complex in which the two fragments interact with each other covalently (open-shell interaction).
First, we need to generate Gaussian output file for CH3 (fragment 1), NH2 (fragment 2) and CH3NH2 (complex). For fragments 1 and 2, in present example we use unrestricted B3LYP method; while for the complex, since this is a closed-shell system, we use restricted B3LYP method (unrestricted B3LYP can also be used, the CDA result will be the same). The .fch files and corresponding input files can be found in "examples\CDA\CH3NH2" folder, the geometry was pre-optimized under B3LYP/6-31G** level.
Note that both CH3 and NH2 have 5 alpha and 4 beta electrons, while CH3NH2 has 9 alpha and 9 beta electrons. Evidently, the total numbers of alpha and beta electrons in the two fragments, namely 5+5 and 4+4, do not match the ones of the complex. So, we must flip electron spin of one fragment (either CH3 or NH2). In this example, we will flip electron spin of NH2, i.e. exchanging all information about its alpha and beta electrons.
Boot up Multiwfn and input following contents:
examples\CDA\CH3NH2\CH3NH2.fch // Gaussian output file of the complex
16 // Enter CDA module
2 // We define two fragments
examples\CDA\CH3NH2\CH3.fch // Gaussian output file of fragment 1
examples\CDA\CH3NH2\NH2.fch // Gaussian output file of fragment 2
n // Do not flip electron spin of fragment 1
y // Flip electron spin of fragment 2, then NH2 will have 4 alpha and 5 beta electrons.
CDA and ECDA results will be calculated and printed on screen for alpha electrons and beta electrons separately. As you can see, for alpha (beta) part, both d - b and CT(1->2) - CT(2->1) terms are positive (negative), showing that alpha (beta) electrons are transferred from CH3 to NH2 (from NH2 to CH3). This is mainly because CH3 has more alpha electrons (5) than beta electrons (4), while after flipping electron spin, NH2 has more beta electrons (5) than alpha electrons (4), hence when they combine together to form CH3NH2, CH3 prefers to donate alpha electrons to NH2 and accept beta electrons from NH2.
Result of total electrons, namely the sum of alpha and beta results is also outputted. Below is total result of CDA and ECDA, respectively
d=  0.044335  b=  0.145181  d - b = -0.100847  r= -0.172318
CT( 1-> 2) - CT( 2-> 1) for all electrons:    0.1252
It is obvious that electrons should transfer from CH3 to NH2, because nitrogen has evidently larger electronegativity. The total ECDA result is in line with our expectation, it shows that the amount of transferred electrons from CH3 to NH2 is 0.1249. However, the d - b term conflicts with our expectation, the transfer direction is totally inverted. This example illustrates that d - b term is not as reliable as ECDA to reveal total amount of net electron transfer for open-shell interaction, although d and b terms are still quite useful for decomposing electron transfer into orbital contributions.
If you select to flip electron spin for CH3 rather than for NH2 when loading their Gaussian output files, you will see the alpha and beta results of CDA and ECDA are exchanged, but the result for total electrons remains unchanged.
Now select 2 and input 6, you will see both the composition of the 6th alpha orbital and the 6th beta orbital of the complex are printed on screen. Though the complex is a closed-shell system and thus the two orbitals are essentially the same, owing to the alpha and beta FOs in the two fragments are not equivalent, the printed compositions have slight difference. Then input 0 to return.
Select option 5 to enter the menu for plotting orbital interaction diagram. By option 5 in this menu, you can switch the spin of the orbitals that the diagram will be plotted for. We select it once to switch the status to "Beta", then choose option 3 and input -30,10 to change the lower and upper limits of the diagram to -30 and 10 eV, respectively. Then select option 1 to plot the orbital interaction diagram. From the graph it is very clear that beta orbital 3 and 4 of CH3NH2 are formed by mixing beta FO 2 in CH3 and beta FO 2 in NH2. To illustrate this point more intuitively, corresponding part is extracted from the whole diagram, and the orbital isosurfaces are attached on it, see below
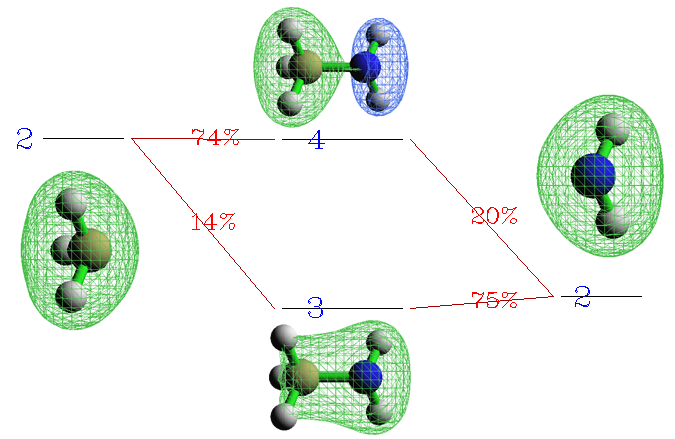
It can be seen that beta complex orbital 3 shows bonding character (this is why r(3) is a positive value, namely 0.103), which is constructed by slightly mixing beta FO 2 of CH3 into beta FO 2 of NH2 with the same wavefunction phase. Beta complex orbital 4 is an anti-bonding orbital (this explained why r(4) is a negative value, namely -0.056), formation of which is due to the mixture of beta FO 2 of NH2 into beta FO 2 of CH3 in terms of different phases.
4.16.3 More than two fragments case: Pt(NH3)2Cl2
In this section I use cisplatin (see below) as instance to show how to perform CDA analysis on the system consisting of more than two fragments.
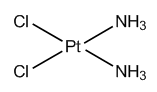
We will define Pt2+ cation, (Cl2)2- anion and (NH3)2 as fragment 1, 2 and 3 respectively. This definition of fragments is the best choice for present system. Note that the Pt2+ cation is in 3d8 low-spin configuration, so that all fragments are in closed-shell status and thus we will not need to analyze alpha and beta spins separately.
The related Gaussian input files and resulting .fch files have been provided in examples\CDA\Pt(NH3)2Cl2 folder. Lanl2DZ pseudopotential basis set was used for Pt, cc-pVDZ was used for other atoms. B3LYP functional was chosen as the theoretical method. The geometry of the complex has already been optimized. In the input file of Pt2+, "scf=xqc" keyword was used to solve the nonconvergence problem, but this is not needed in general.
Note 1
For certain types of basis sets, such as Pople series of basis sets (e.g. 6-31G*), by default Gaussian employs Cartesian type basis functions rather than spherical-harmonic basis functions, which may result in inconsistency problem of basis set between complex and fragment calculations. If you are not very familiar with Gaussian, I highly recommend you always add 5d keyword in all Gaussian input files when mixed basis set is used in the calculation of the complex.
Note 2
The sequence of the fragments is crucial. Because in the input file of complex, the atomic sequence is Pt--Cl2--(NH3)2, we should not for example define Pt2+, (NH3)2 and (Cl2)2- as fragment 1, 2 and 3, respectively.
Now boot up Multiwfn and input:
examples\CDA\Pt(NH3)2Cl2\Pt(NH3)2Cl2.fch // Complex
16 // CDA module
3 // Define three fragments
examples\CDA\Pt(NH3)2Cl2\Pt.fch // Fragment 1
examples\CDA\Pt(NH3)2Cl2\Cl2.fch // Fragment 2
examples\CDA\Pt(NH3)2Cl2(NH3)2.fch // Fragment 3
Then choose option 0 and input 1,2 to output CDA analysis result for fragment pair 1-2. Similarly, we get the CDA result for fragment pair 1-3 and 2-3. We cannot obtain ECDA result for present system because ECDA is only applicable to two-fragment cases. The total CDA results are summarized below.
| 1-2 | 1-3 | 2-3 | |
|---|---|---|---|
| d | 0.0017 | 0.0077 | 0.0538 |
| b | 0.5156 | 0.0368 | 0.0071 |
| d-b | -0.5139 | -0.0291 | 0.0467 |
| r | 0.0581 | -0.0579 | -0.1415 |
The table shows that there are 0.5156 and 0.0368 net electrons transferred from (Cl2)2- and (NH3)2 to Pt2+, respectively. Basically, no electrons are donated from Pt2+ to its ligands. This result is in line with our chemical intuition because according to classical theory, the electrons of coordinate bonds are purely contributed from ligands. The charge transfer between (Cl2)2- and (NH3)2 is trivial, mainly due to there is no direct chemical interaction between them. Note that the r term between fragment 2 and 3 is a small but non-negligible negative value, exhibiting that there is detectable electron repulsion effect between the ligands.
Deeper analyses of this system are left for you. You can discuss orbital contribution to charge transfer based on the detailed output of CDA analysis, use option 2 to study the composition of complex orbital in fragment orbital basis, and use option 5 to plot orbital interaction diagram.
4.16.4 CDA analysis based on restricted open-shell wavefunction: ethane
Usually unrestricted (U) formalism is used for calculating open-shell systems (complex and/or fragments) in CDA analysis since U is cheaper and faster than restricted open-shell (RO) formalism. However, the advantage of using RO wavefunctions for CDA analysis is that one does not need to explicitly distinguish alpha and beta orbitals, since RO only generates single set of orbitals; in other words, the alpha and beta orbitals share identical shape. In this section, I illustrate how to correctly perform CDA analysis based on RO wavefunctions. Ethane is taken as example, the two methyl groups will be chosen as the two fragments.
First, we optimize ethane using (R)B3LYP/6-31G* level, the corresponding Gaussian input file is examples\CDA\CH3CH3\ethane.gjf, the output file is also provided, and the corresponding resulting .fch file converted by formchk utility is ethane.fch in the same folder. We extract coordinates of the two methyl groups from the optimized ethane and save them as two respective Gaussian input files, namely CH3_1.gjf and CH3_2.gjf in “examples\CDA\CH3CH3\” folder; as you can see, their calculation levels are ROB3LYP/6-31G*. After running the two .gjf files and converting the .chk file via formchk, we obtain CH3_1.fch and CH3_2.fch.
Although you can directly use the ethane.fch, CH3_1.fch and CH3_2.fch to carry out CDA analysis as usual (since none of them is unrestricted wavefunction, CDA will be conducted in closed-shell form), you will find the CDA result is incorrect, because both the two methyl group fragments are regarded as having 5 alpha and 4 beta electrons.
To correctly perform CDA analysis based on RO wavefunction, you should manually transform the RO wavefunction to U wavefunction; in other words, splitting RO orbitals to alpha and beta orbitals. As an example, we do this transformation for CH3_1.fch. Boot up Multiwfn and input
examples\CDA\CH3CH3\CH3_1.fch
6 // Modify wavefunction
37 // Split spatial orbitals (RO orbitals in the current context) as alpha and beta spin orbitals
-1 // Return
100 // Other functions (Part 1)
2 // Export current wavefunction to a file
7 // Export to .fch file
CH3_1_UKS.fch // Name of new file
The CH3_1_UKS.fch records UKS wavefunction, which includes alpha and beta orbitals with the same shapes and energies but different occupancies. Similarly, please transform CH3_2.fch to CH3_2_UKS.fch in the same way.
Now we can conduct CDA analysis. Boot up Multiwfn and input
examples\CDA\CH3CH3\ethane.fch
16 // CDA
2 // Two fragments
examples\CDA\CH3CH3\CH3_1_UKS.fch
examples\CDA\CH3CH3\CH3_2_UKS.fch
n // Do not flip spin of fragment 1
y // Flip spin of fragment 2
The result is:
                     **** Result for alpha electrons ****

    Orb.      Occ.          d           b        d - b          r
       1    1.000000   -0.000018   -0.000036    0.000018   -0.000201
       2    1.000000    0.000406    0.000237    0.000169    0.000750
[ignored]
      13    0.000000    0.000000    0.000000    0.000000    0.000000
  ......
 -------------------------------------------------------------------
 Sum:       9.000000    0.154365   -0.001225    0.155589   -0.137034

                     **** Result for beta electrons ****

    Orb.      Occ.          d           b        d - b          r
       1    1.000000   -0.000036   -0.000018   -0.000018   -0.000201
       2    1.000000    0.000237    0.000406   -0.000169    0.000750
[ignored]
      13    0.000000    0.000000    0.000000    0.000000    0.000000
  ......
 -------------------------------------------------------------------
 Sum:       9.000000   -0.001225    0.154365   -0.155589   -0.137034
According to common knowledge about chemical bonds, the first CH3 uses its alpha unpaired electron to form C-C bond with beta unpaired electron of another CH3. From CDA point of view, as shown above, during formation of the C-C bond, the first CH3 transfers 0.155 alpha electron to unoccupied alpha orbital of the second CH3, while the second CH3 transfers 0.155 beta electron to unoccupied beta orbital of the first CH3. This result looks reasonable and in line with chemical intuition.
Then we plot orbital interaction diagram. Input following commands
5 // Plot orbital interaction diagram
3 // Set the energy range to be plotted
-25,10 // From -25 to 10 eV, which was found to be suitable for present case
1 // Plot the diagram now
Now you can see (some MO maps are also attached)
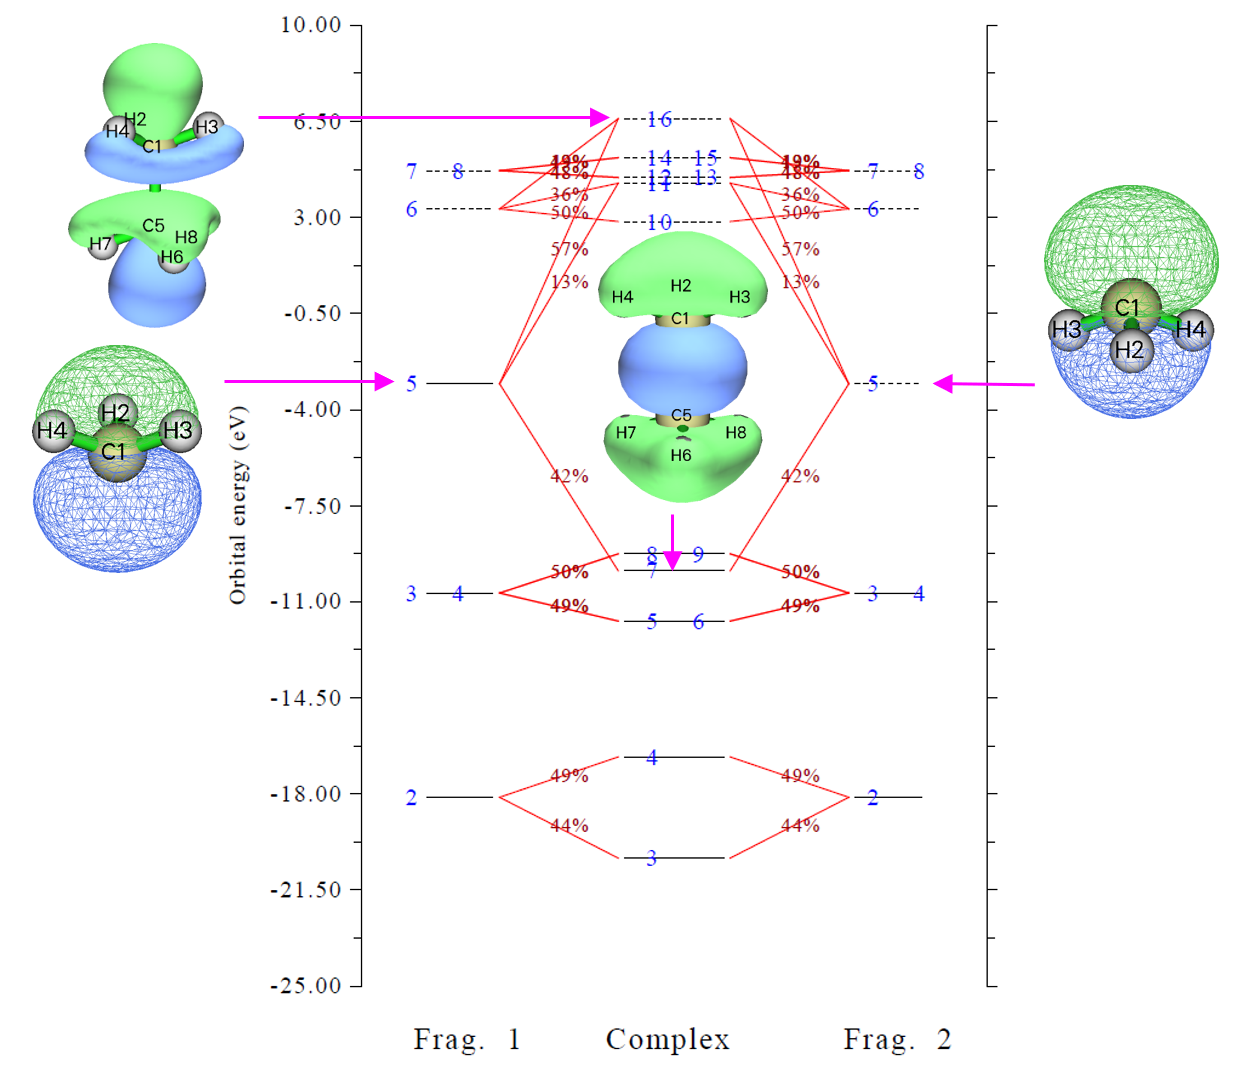
From the map above you can clearly identify how the bonding orbital is generated by mixing MO of the two fragments. This map is currently plotted for alpha spin, while since alpha and beta MOs in the current case are essentially identical (the two sets of spin orbitals of the fragments were equally split from ROKS orbitals as we did before, while the two sets of spin orbitals of the complex are automatically generated by equally splitting RKS orbitals during CDA analysis), the map plotted for beta spin is identical to the map above; the only marginal difference is that in the map for beta spin, you can find the bar of orbital 5 of fragment 1 is dashed (unoccupied) while that of fragment 2 is solid (occupied). In fact, there is no need to view the alpha and beta orbital interaction diagrams as two different maps, you can think that actually there is only one orbital interaction diagram, in which the orbitals 1~4 of fragments 1 and 2 are doubly occupied, while the orbital 5 of fragment 1 is unpaired alpha electron orbital and orbital 5 of fragment 2 is unpaired beta electron orbital.
It is worth to note that if you plot this orbital interaction diagram based on ROKS fragment orbitals, you will find that for each spin, complex orbitals are not always equally contributed by fragments orbitals of the two fragments despite the two methyl groups are chemically equivalent, this is because alpha and beta ROKS orbitals do not share identical energies and shapes. Obviously, analyzing based on ROKS orbitals makes discussion markedly easier than based on UKS orbitals, for which you have to study interaction diagram of alpha and beta spins respectively.