Pages: 1 2 3 4 5 6 7 8 9 10
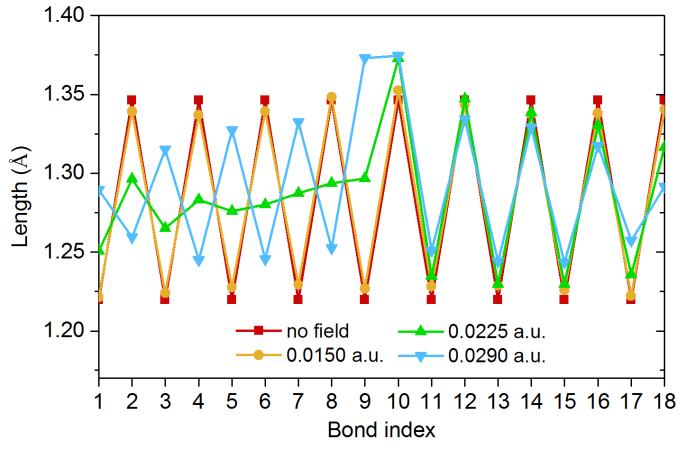
- Bond length alternation (BLA) of cyclo[18]carbon with and without external electric field. See ChemPhysChem (2021) DOI: 10.1002/cphc.202000903 for detailed discussion of this map. See Section 3.200.18 of manual for introduction of BLA and Section 4.200.18 for calculation example.
- Cyclo[18]carbon under strong external electric field. See ChemPhysChem (2021) DOI: 10.1002/cphc.202000903 for detailed discussion. (a) ELF map on the molecular plane. It can be seen that there are electrons have almost detached from the molecule. See Section 4.4 of Multiwfn manual for example of plotting plane map. (b) Isosurface map of the Foster-Boys localization orbital corresponding to the nearly detached electrons. See Section 4.19 of manual for examples of performing orbital localization.

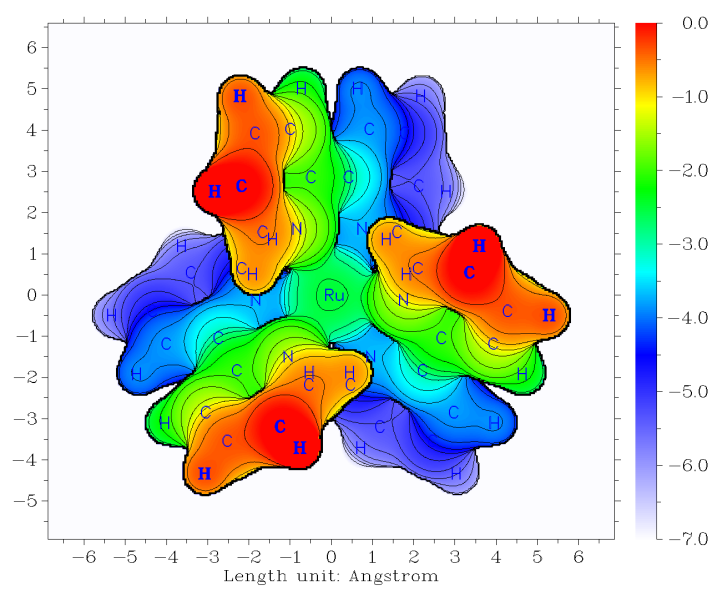
- Distance projection map of molecular surface of Ru(bpy)3. The color clearly exhibits vertical distance of every point of molecular surface to screen, the atom nearest to screen is taken as origin. The molecular surface is defined as electron density isosurface of 0.05 a.u. in this context. This kind of map is very useful in graphically characterizing molecular structure and identifying possible steric effect. See Section 4.300.8 of manual on how to plot this map.
- Averaged NCI (aNCI) map graphically revealing interactions between ligand and protein during molecular dynamics simulation (PDB ID: 3ATL). The molecular dynamics simulation was conducted by GROMACS, grid data of aNCI was produced by Multiwfn, and finally the map was rendered by VMD. See http://sobereva.com/591 no how to plot this map.

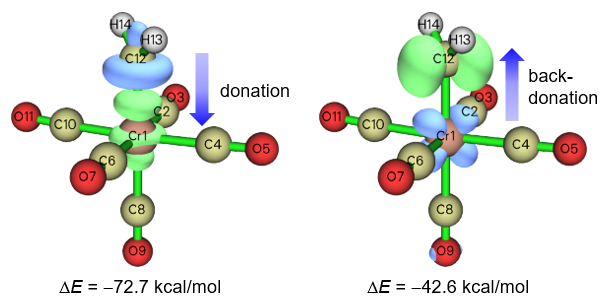
- Extended Transition State - Natural Orbitals for Chemical Valence (ETS-NOCV) analysis for orbital interaction of (CO)5Cr...CH2. It can be seen that the donation and back-donation between the CH2ligand and Cr are distinguished and clearly shown. See Section 3.26 of manual for detailed introduction of ETS-NOCV analysis and Section 4.23 of manual for abundant analysis examples.
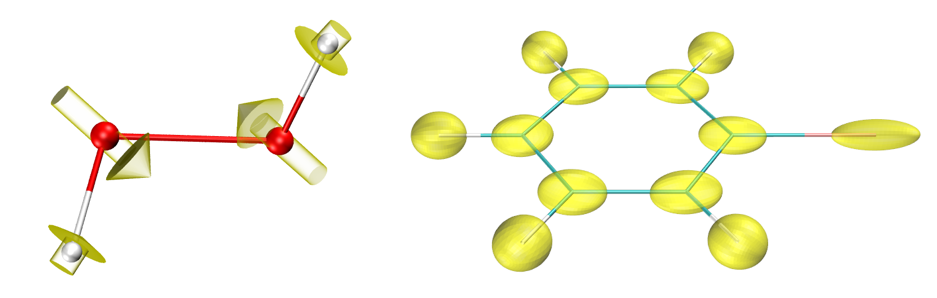
- Atomic electric dipole moments of H2O2, and atomic electric quadrupole moments of C6H5Br. The data were calculated by Multiwfn, while the maps were plotted by VMD via a script provided in Multiwfn package. See Section 4.15.5 of manual for introduction and examples.
- Multiwfn cannot only simulate UV-Vis spectrum, but also convert it to the color of adsorbed light and complementary color, the latter corresponds to the color actually displayed by the subtance. Indigo is taken as example, the left side of the map is its UV-Vis spectrum in water simulated by Multiwfn based on TD-B3LYP/def2-TZVP calculation, the complementary color at right side of the map is the color actually displayed by indigo predicted by Multiwfn. See Section 3.13.7 of Multiwfn manual for introduction and Section 4.11.14 for practical example.

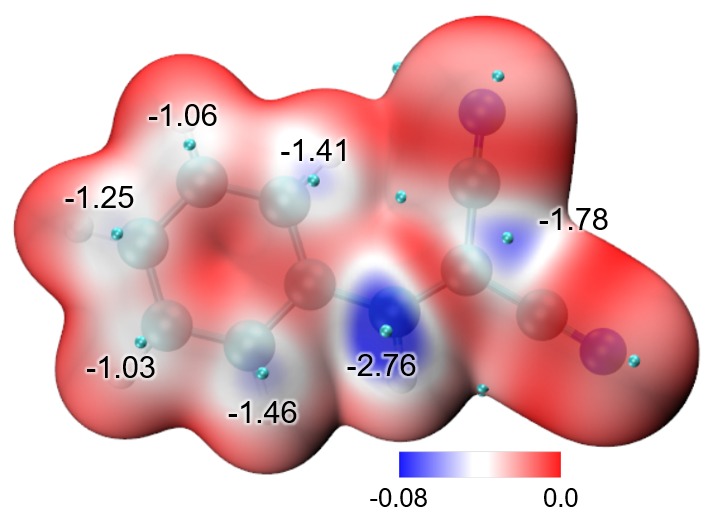
- Local electron attachment energy (LEAE) plotted by Multiwfn+VMD for benzylidenemalononitrile. The blue region is the most electrophilic region, which is also the most vulnerable site to nucleophilic attack and reaction. Cyan spheres correspond to surface minima of LEAE, values are labelled by eV. See Section 4.12.13 of Multiwfn manual for introduction of LEAE and how to plot this kind of map.
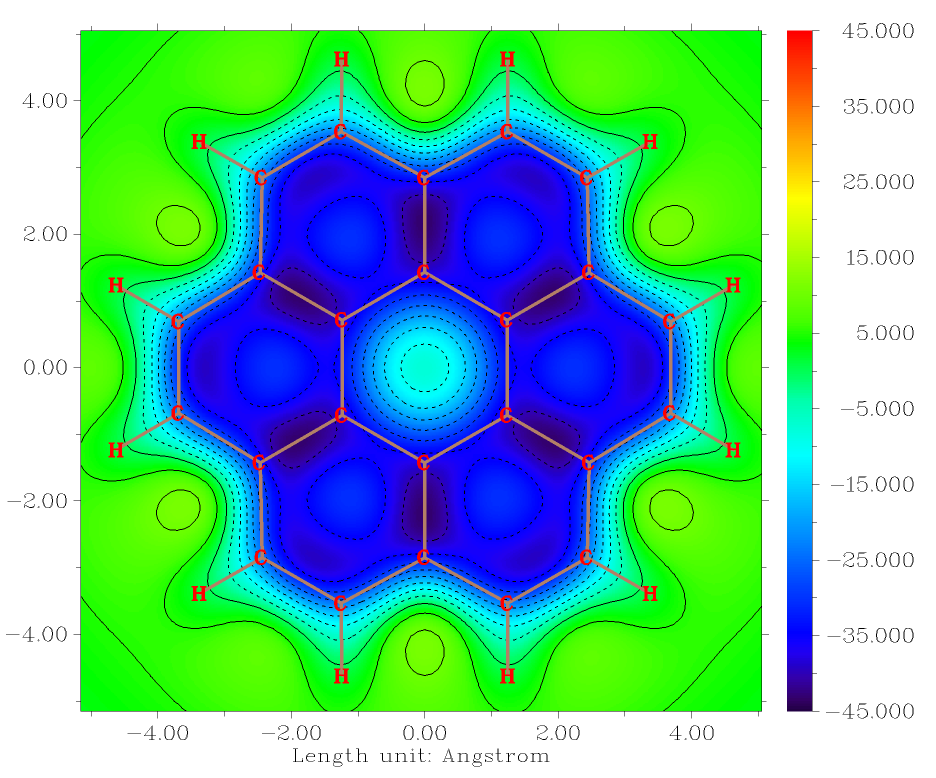
- Plane map of NICSZZ above 1 Å of coronene. See Section 4.25.14 of Multiwfn manual on how to use Multiwfn in combination with Gaussian to very easily plot this kind of map.
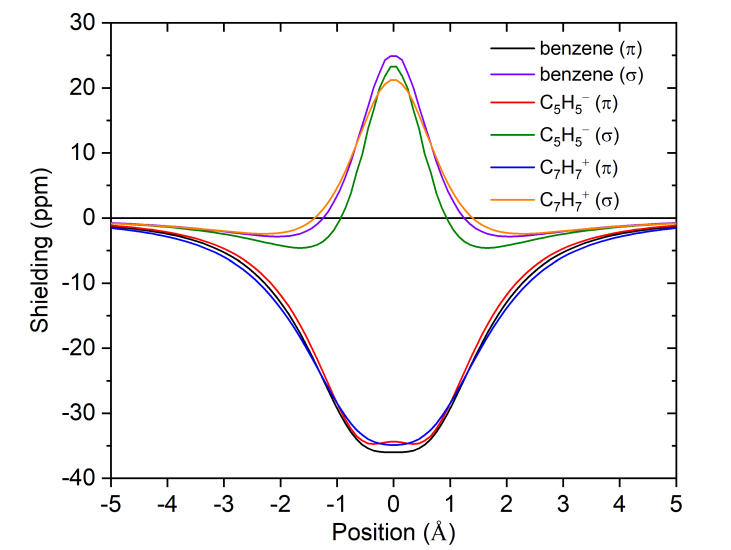
- NICSZZ curves contributed by σ and π electrons of C6H6, C5H5- and C7H7+. The scanning line is perpendicular to the ring and passes through ring center. See Section 4.25.13 of Multiwfn manual on how to use Multiwfn in combination with Gaussian to very easily plot this kind of map.
Previous Page Next Page