Pages: 1 2 3 4 5 6 7 8 9 10
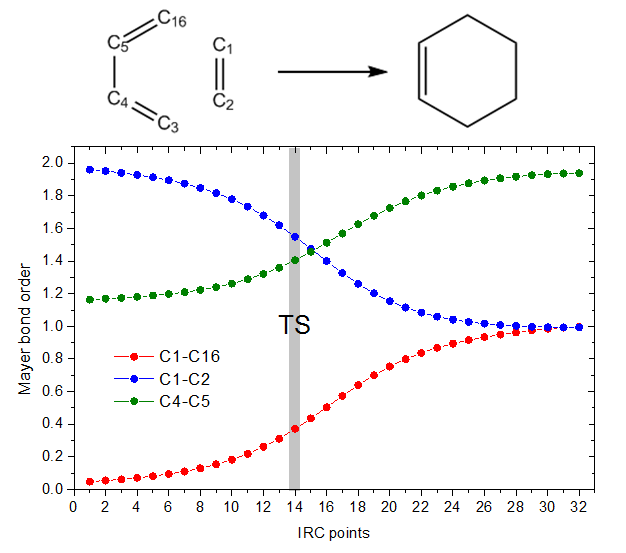
- Using Multiwfn with shell script, variation of electronic structure can be easily investigated. Below is an example of Diels-Alder addition, the variation of Mayer bond order of three bonds are plotted. See Section 4.A.1 of Multiwfn manual on how to plot this map.
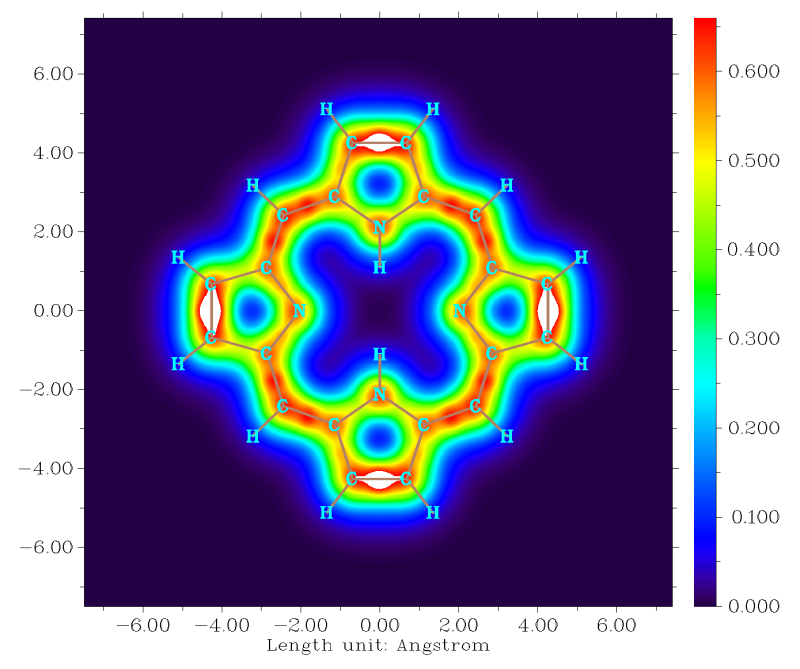
- LOL-pi map above 1.2 Bohr of porphyrin. From this map the favorable delocalization path of pi electrons can be very clearly identified. See Section 4.4.9 of the manual on how to plot this map.
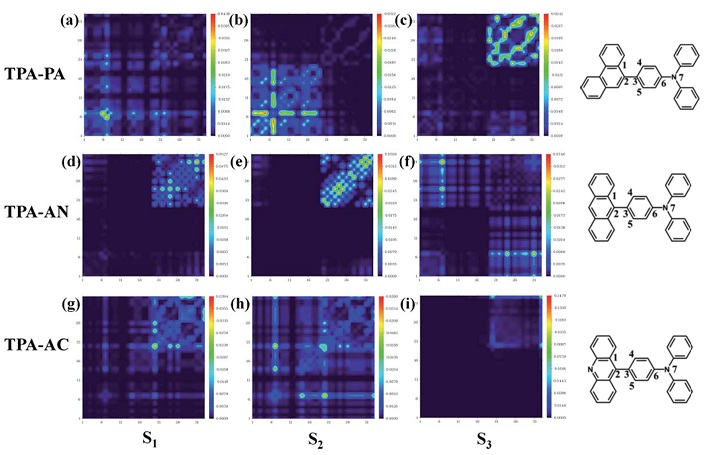
- Transition density matrix plot. From the graph it is easy to identify the molecular fragment that mainly participated in the electronic exitation. See RSC Adv., 7, 19576 (2017) for discussion. See Section 4.18.2 of the manual on how to plot this kind of map.
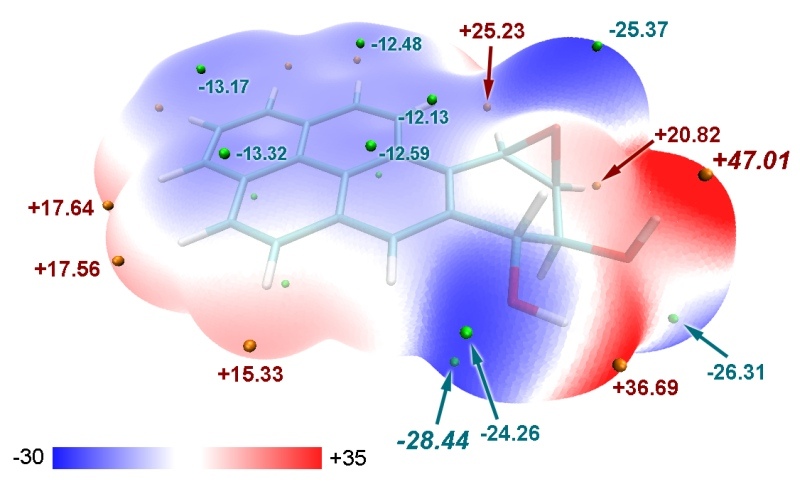
- ESP distribution on van der Waals surface of benzo[a]pyrene diol epoxide (see Struct. Chem., 25, 1521 (2014) for more details). The locations and values of surface minima and maxima of ESP are clearly shown on the graph. This graph was plotted by VMD based on the output of quantitative molecular surface analysis module of Multiwfn. If you want to plot this kind of map, see Plotting electrostatic potential colored molecular surface map with ESP surface extrema via Multiwfn and VMD.
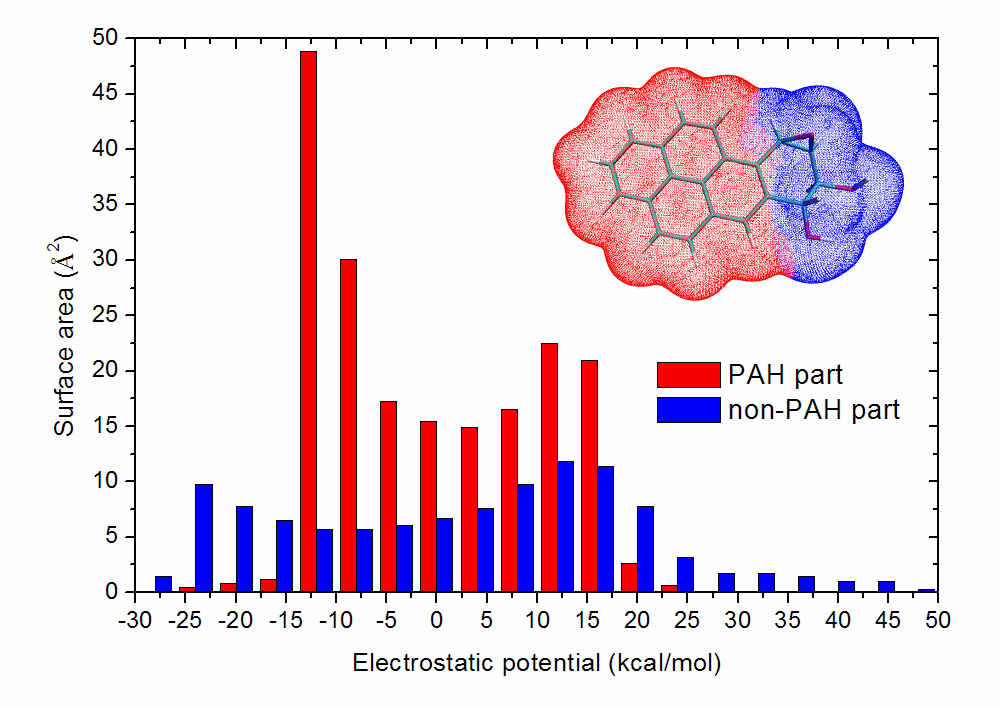
- ESP distribution on van der Waals surface corresponding to PAH and non-PATH parts of benzo[a]pyrene diol epoxide. This example utilizes local surface analysis function of Multiwfn. See Sections 4.12.1 and 4.12.3 on how to generate data for plotting this map.
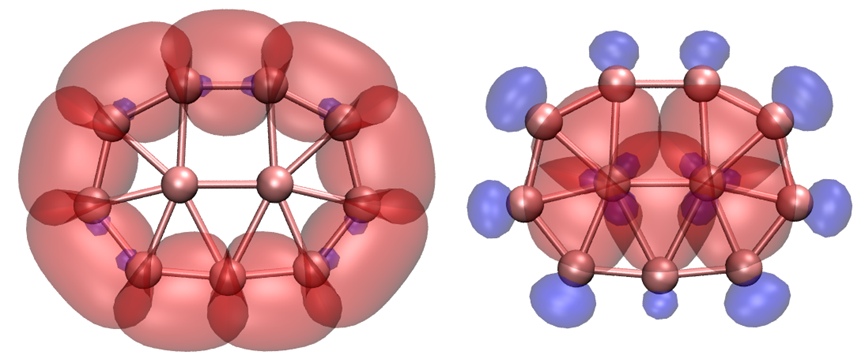
- All two-center two-electron (2c-2e) orbitals as well as all 3c-2e orbitals of B11- cluster produced by adaptive natural density partitioning (AdNDP) analysis. See Section 4.14 of the manual on how to perform this kind of analysis. The graph is plotted by VMD based on Multiwfn outputs (Multiwfn itself is also able to plot AdNDP orbitals)
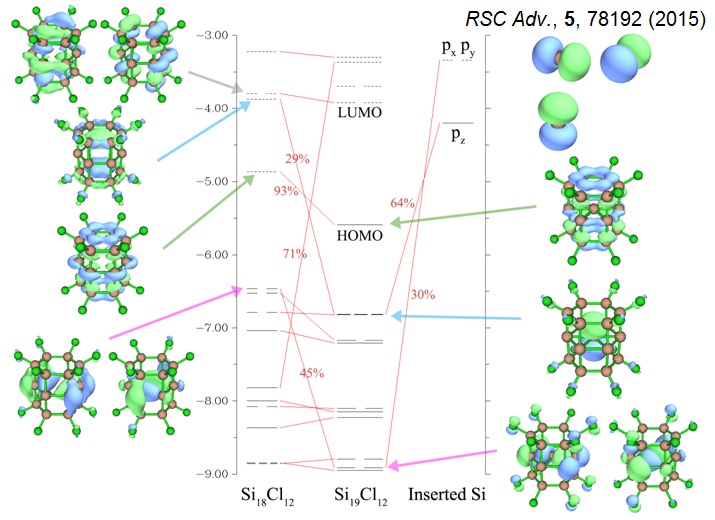
- Orbital interaction diagram of Si18Cl12 cage and inserted Si atom. Solid and dash bars correspond to occupied and unoccupied orbitals, respecitvely. If contribution of a fragment orbital to a complex orbital is relatively large, then corresponding two bars are linked, and the contribution value is labelled by red texts. See RSC Adv., 5, 78192 (2015) on more information about this graph. If you want to plot this kind of map, see examples in Section 4.16 of the manual.
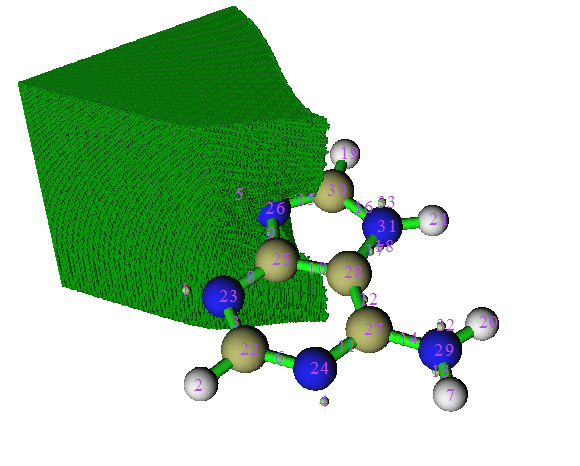
- ELF basin corresponding to the lone pair of nitrogen in adenine. Light green spheres denote ELF attractors, the labels are attractor indices. By using Multiwfn, integral of any real space space function in the basins can be easily obtained, electric multipole moments and localization/delocalization index can be calculated for the basins. See Section 4.17.2 of the manual on how to carry out this kind of analysis.
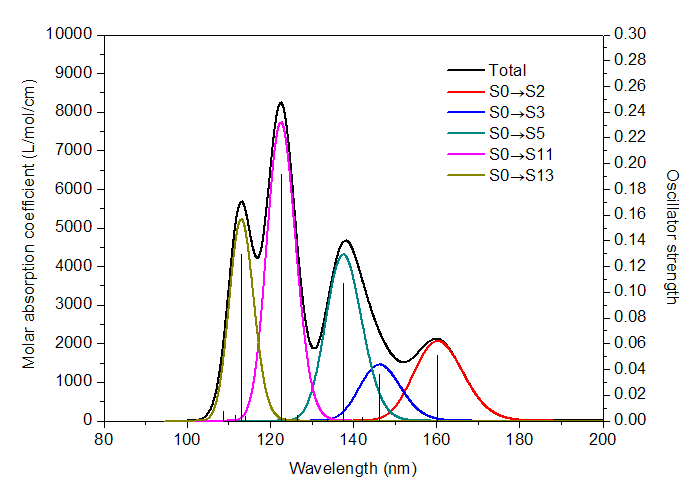
- UV-Vis spectrum plotted by Origin in combination with Multiwfn. The total spectrum is decomposed into contributions from different transitions. This feature makes analysis of nature of various absorption peaks quite easy. The procedure of plotting this map is described in Section 4.11.2 of the manual.
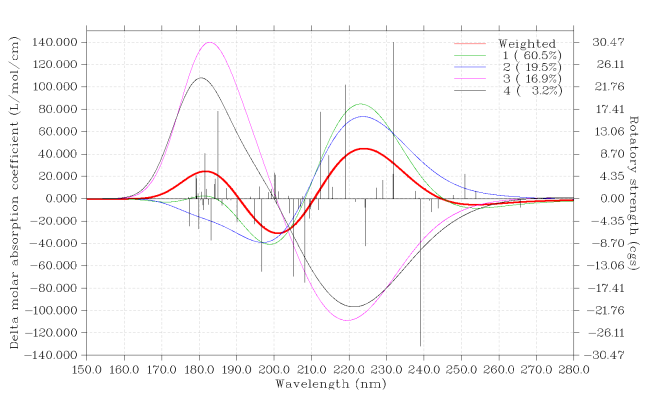
- Conformationally averaged ECD spectrum of plumericin directly plotted by Multiwfn. The green, blue, pink and black curves correspond to contribution of four thermally accessible conformations to the weighted spectrum (red curve). See Section 4.11.4 of the manual on how to plot this kind of map.
Previous Page Next Page