Pages: 1 2 3 4 5 6 7 8 9 10
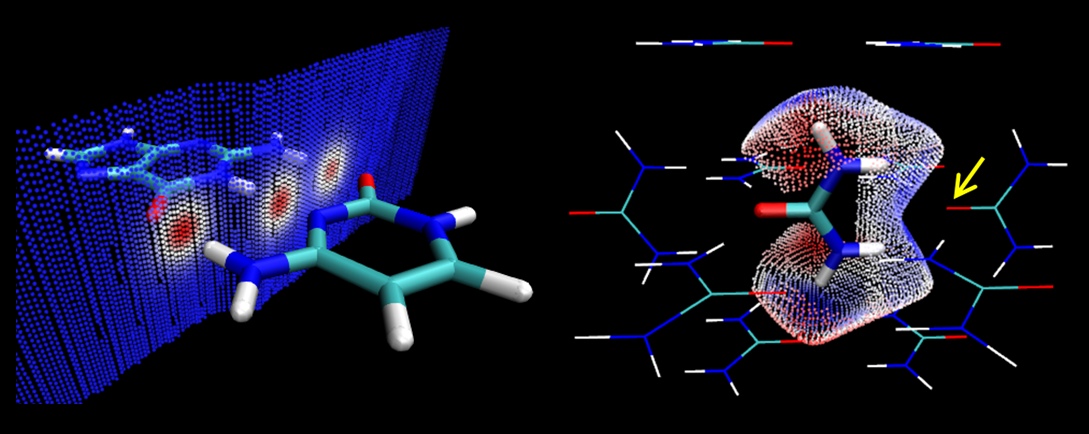
- Left: Becke surface analysis on guanine-cytosine base pair. Right: Hirshfeld surface analysis on the two amino groups of urea in crystal environment. They are useful for discussing weak interactions. See Sections 4.12.5 and 4.12.6 on how to plot this kind of map, the graphs were rendered by VMD based on outputted file of Multiwfn. The so-called finger map can also be plotted by Multiwfn.
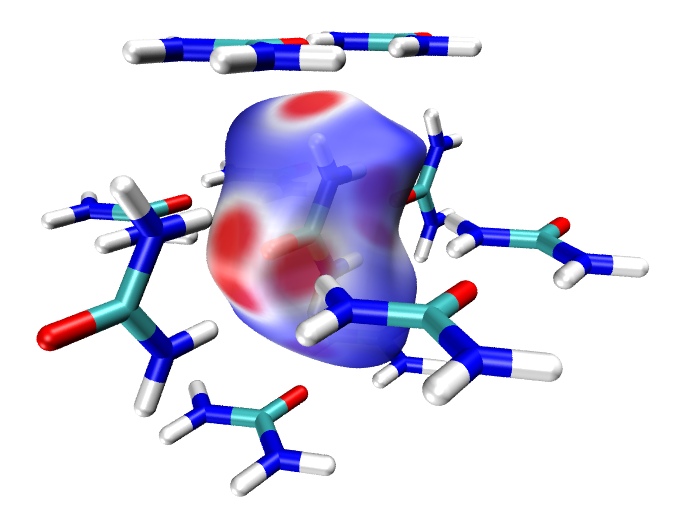
- Hirshfeld surface mapped by electron density evaluated under promolecular approximation. The strong intermolecular interaction between the central urea and surrounding ureas are vividly revealed by red color, which corresponds to relatively large electron density. The graph was rendered by VMD based on cube file outputted by Multiwfn. See Section 4.12.6 on how to draw such a graph.
- Isosurface graph of molecular orbital of carbon nanotube segment. VMD is used to render the graph based on cube file outputted by Multiwfn. See Section 4.0.3 of Multiwfn manual on how to plot.

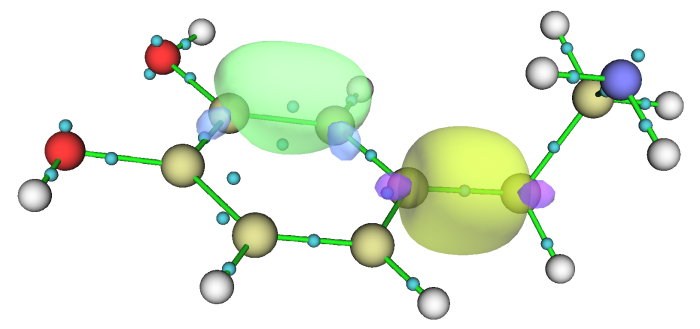
- Localized molecular orbital (LMO) analysis for dopamine. Each sphere denotes center position of an occupied LMO. Isosurface of a pi-LMO and a sigma-LMO is shown. Example of performing this kind of analysis is given in Section 4.19.1 of Multiwfn manual.
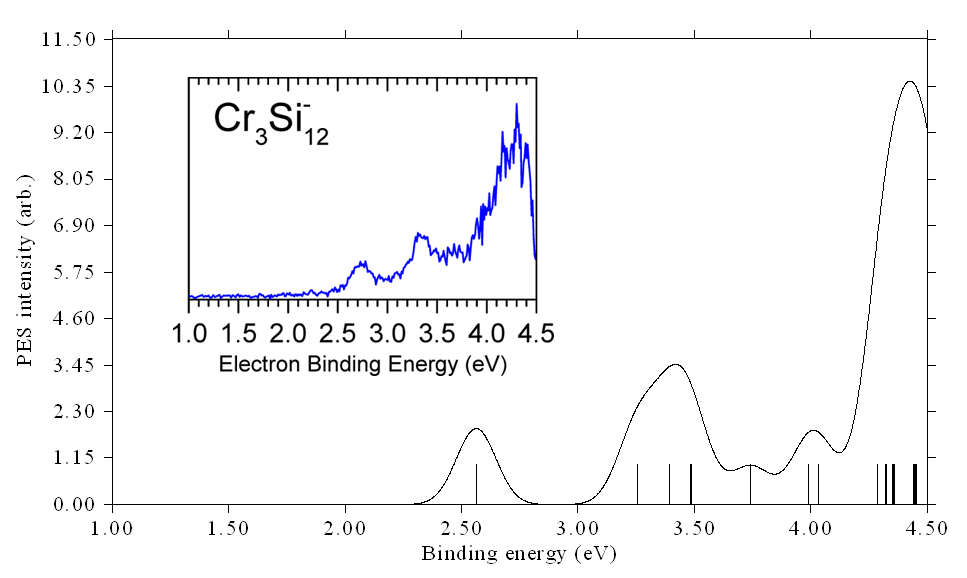
- Photoelectron spectrum of Cr3Si12- simulated by Multiwfn using .fch file of Gaussian based on generalized Koopmans' theorem. The inset is experimental spectrum presented in J. Phys. Chem. A, 122, 9886 (2018). See Section 4.10.4 of manual on how to plot such a spectrum.
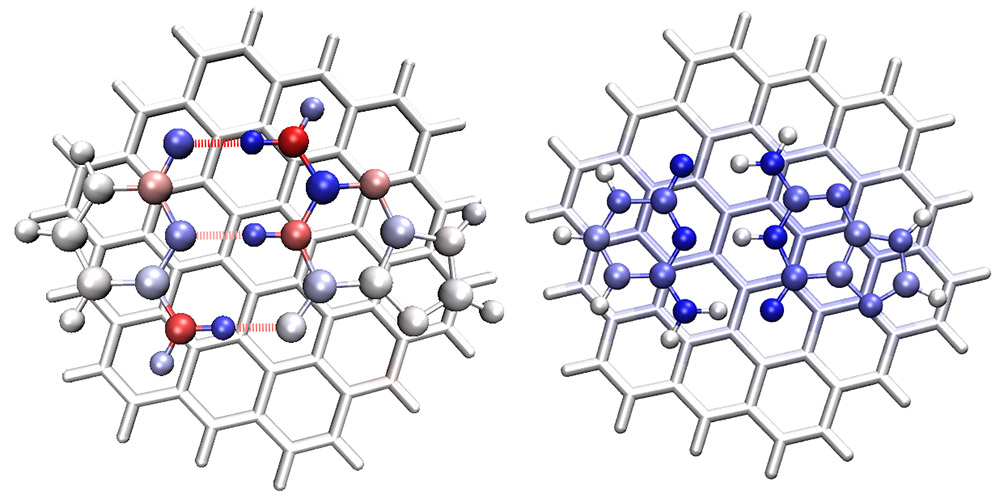
- Energy decomposition analysis based on GAFF force field for Circumcoronene-Cytosine-Guanine trimer, the images were rendered by VMD based on data exported by Multiwfn. In the left graph, atomic colors reveal contribution to the binding energy between the G-C pair, while in the right graph, the atomic color indicates contribution to dispersion interaction between the G-C pair and the circumcoronene. See Section 4.21.1 on how to carry out this kind of analysis.
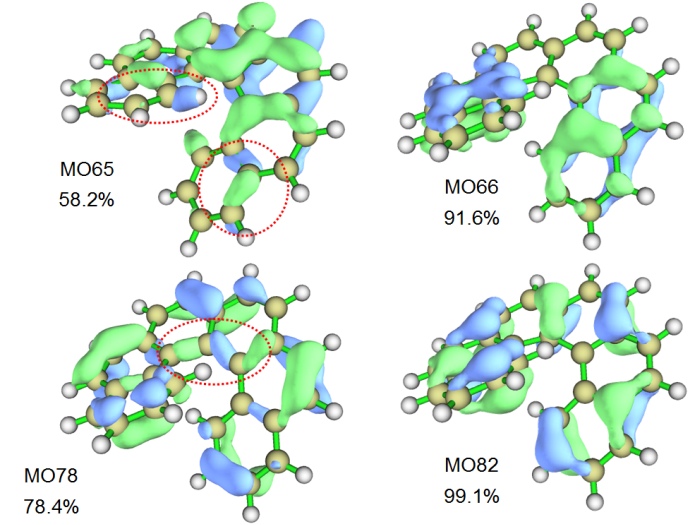
- Multiwfn is able to automatically determine percentage of pi character for any kind of orbitals, as illustrated below (four MOs of helicene. Evident sigma regions are circled). See Section 4.100.22 of Multiwfn manual for example.
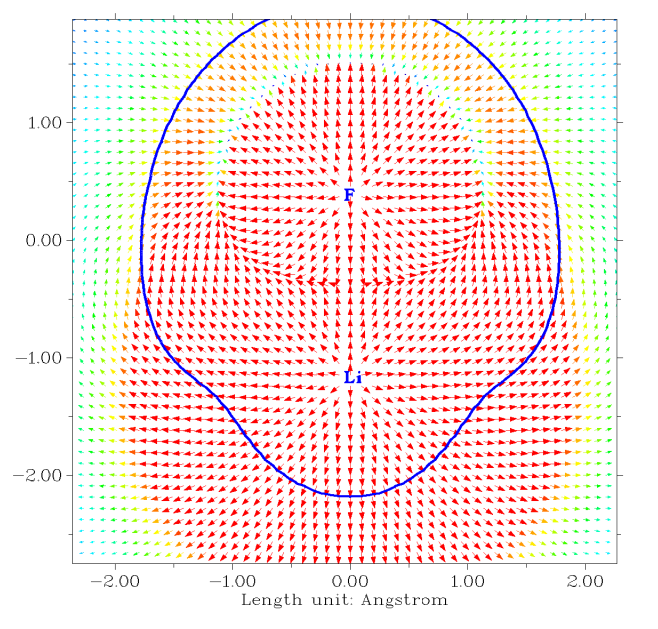
- Electric field of LiF. The arrows exhibit field direction while color reflects magnitude. The blue contour reveals van der Waals surface. See Section 4.4.10 of manual on how to plot this map
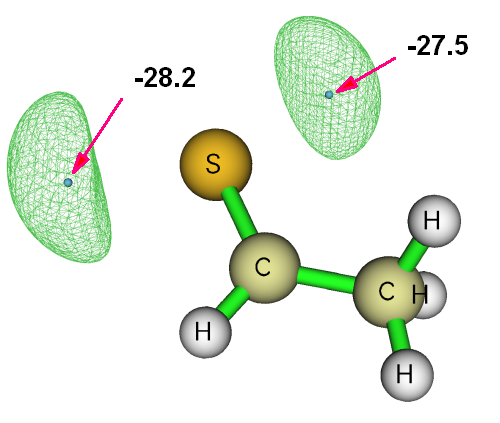
- Minimum points and isosurface of electrostatic potential (ESP) of ethanethiol. The isovalue is set to higher than global minimal value by 10 kcal/mol. The ESP value (in kcal/mol) of the two ESP minimum points is labelled. This map clearly reveals occurrence region of lone pairs. See Section 4.17.4 of manual on how to plot similar map
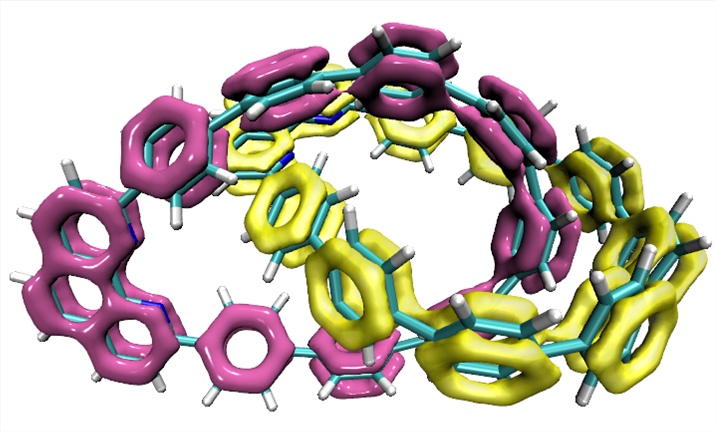
- LOL-pi map of two Mobius nano rings. The LOL-pi cube files were generated by Multiwfn (see Section 4.100.22 of manual on how to calculate LOL-pi), the map was finally rendered by VMD.
Previous Page Next Page