Pages: 1 2 3 4 5 6 7 8 9 10
- Natural transition oribtal (NTO) of S0→S5 transition of N-phenylpyrrole at TD-CAM-B3LYP/6-31+G* level. The NTO pair having largest contribution to the electronic excitation, namely the 38th and 39th NTOs, are shown together. Multiwfn can not only generate NTOs, but also analyze orbital character, for example, the centroids of the orbitals are computed and shown in the graph. The distance between the two centroids is a good measure of charge transfer degree. See Section 4.18.6 of the manual on how to carry out NTO analysis, as well as Section 3.100.11 on how to calculate quantitative indices and visualize the centroids.

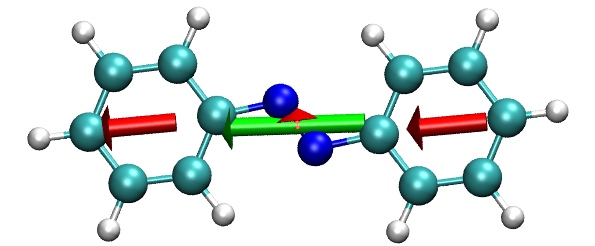
- Green arrow denotes total transition dipole moment, the three red arrows exhibit contribution of respective molecular fragment to transition dipole moment. The graph was drawn by VMD based on analysis result of Multiwfn. See Section 4.18.11 of the manual on how to carry out this analysis.
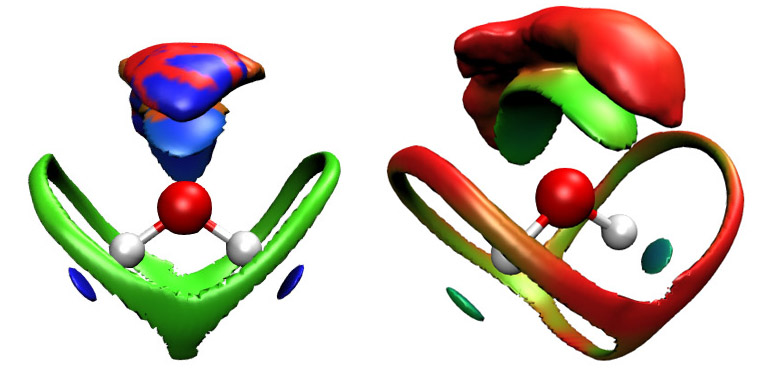
- Averaged noncovalent interaction (aNCI) analysis for water in bulk environment. The left and right parts are sign(λ2)ρ and thermal fluctuation index (TFI) colored aNCI isosurface, respectively. From the graphs one can intuitively recognize regions, types and stabilities of interactions between the molecule and surrounding environment. The images were plotted by VMD based on Multiwfn output file. See Section 4.20.3 of the manual on how to carry out this kind of analysis.
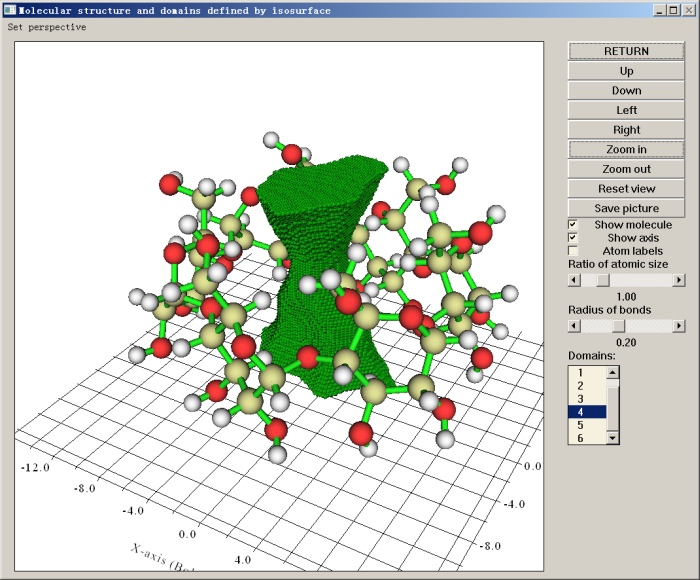
- The domain analysis of Multiwfn is able to evaluate volume and integral of various real space functions for a region enclosed by specific isosurface. For example, below map is the cavity of αcyclodextrin revealed by the domain analysis module, the volume is calculated to be 47Å3. See section 4.200.14.2 on how to perform this analysis.
- Condensed Fukui function of f- type of coronene. The values are mapped on the atoms via different colors. The graph was rendered by VMD based on the Multiwfn outputted file. See section 4.A.10 on how to map Multiwfn calculated atomic properties on atoms by colors.

- Deformation density map during pushing two hydrogens with like-spin electron together. To generate this animation file, firstly generating wavefunction files of every step, then write a script to invoke Multiwfn to handle them and output corresponding graphs, finally use ImageMagick to combine the graphs to a single .gif anime file. See http://sobereva.com/86 for details.

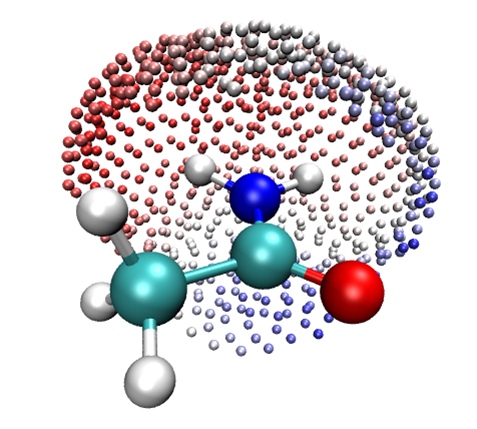
- This map shows electrostatic potential (ESP) at subset of fitting points employed by Merz-Kollman method around the amino group. The map was rendered by VMD based on the file outputted by Multiwfn. By using Multiwfn in combination with VMD, the ESP reproduciliby error of atomic charges on selected points can also be plotted as this kind of map. See Section 4.7.8 for detail
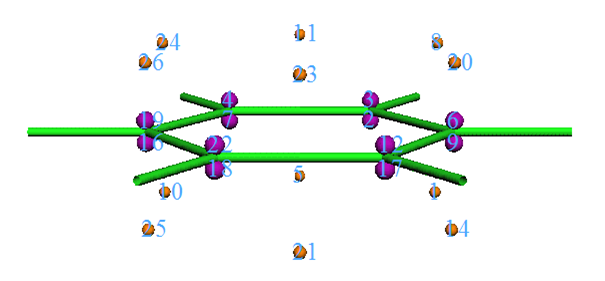
- Topology analysis of ELF-pi function for benzene. Orange and purple spheres correspond to (3,-1) and (3,-3) critical points, the former and latter are also known as bifurcation points and attractors, respectively. See Section 4.5.3 on how to carry out this analysis.
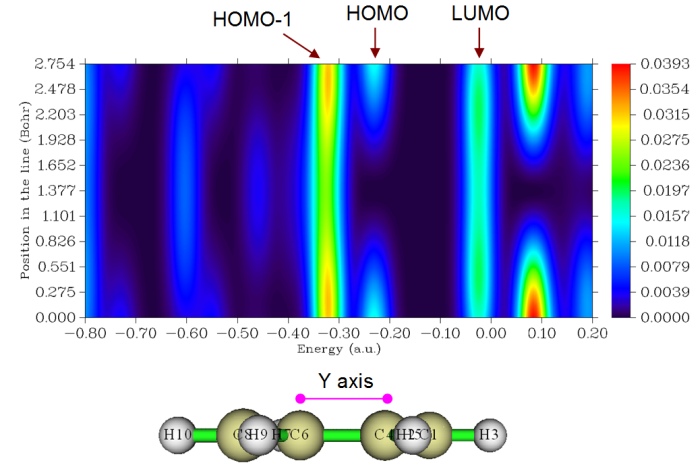
- Local density-of-states (LDOS) of cis-1,3-butadiene, it is useful when interpreting the data from scanning tunneling microscope (STM). See Section 4.10.2 on how to plot this kind of map.
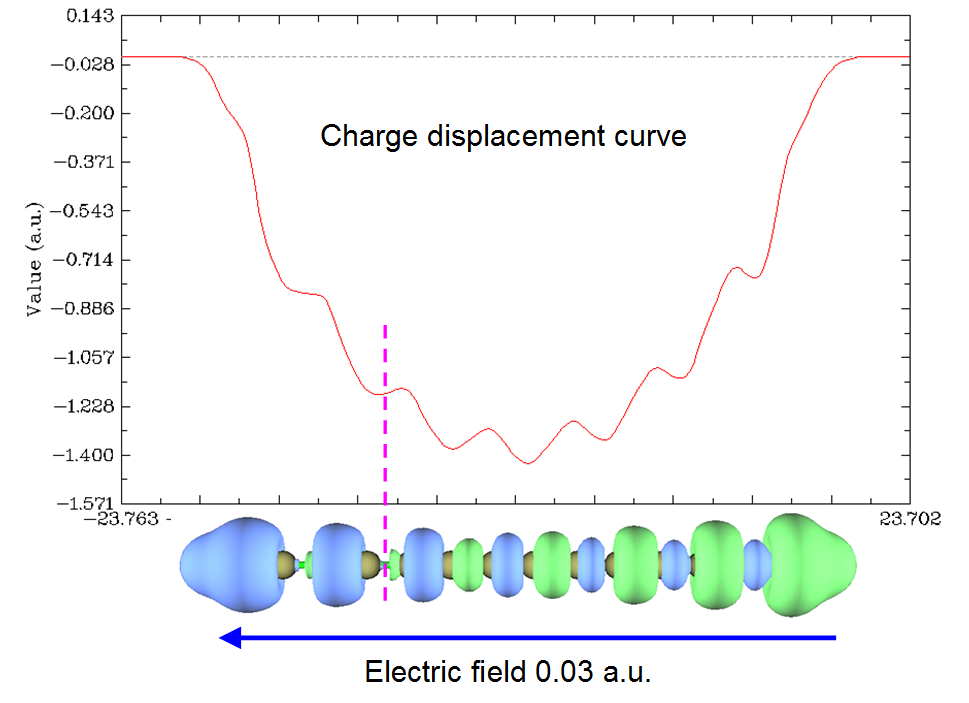
- Charge displacement curve of polyyne under external electric field. This map exhibits integral value from left to right of density difference between the systems with and without the external field. See Section 4.13.6 on how to plot this kind of map.
Previous Page Next Page