Pages: 1 2 3 4 5 6 7 8 9 10
Unless otherwise specified, the graphs below are generated by Multiwfn directly (a few graphs were slightly edited to add insets), no other visualization tool is required, only the file containing wavefunction information is needed. Note that these examples only utilize tiny part of functions of Multiwfn, Multiwfn is much more powerful than the examples illustrated in this page! Also see Multiwfn original paper J. Chem. Phys., 161, 082503 (2024) DOI: 10.1063/5.0216272 and its supplemental information for more graphical illustrations.
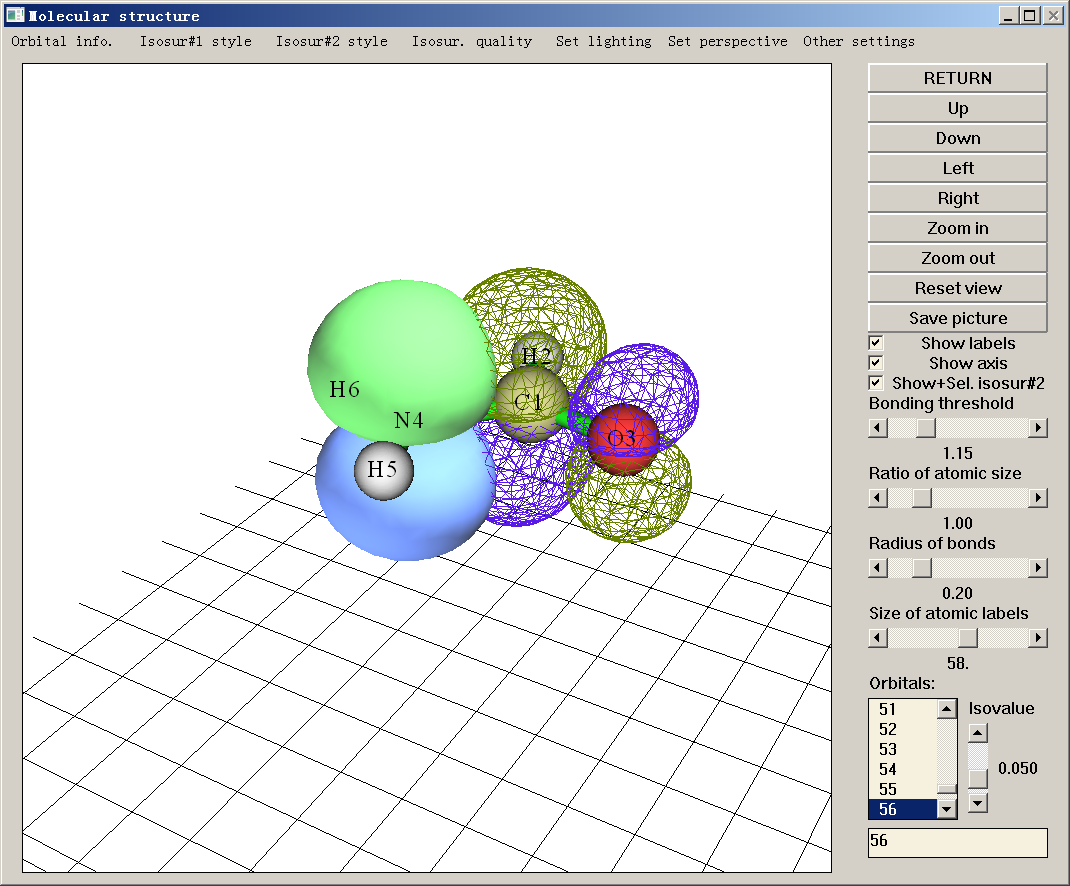
- The 0.08 isosurface of two natural bond orbitals (NBO) of NH2COH, the first one is lone pair of nitrogen, the second one is anti-bonding orbital between carbon and oxygen. The secondary perturbation energy due to their interaction reached about 60kcal/mol. See Section 4.0.2 of the manual on how to visualize these orbitals.
- Contour map of the two NBOs shown above, the drawing plane is perpendicular to molecular plane and passed through both the carbon and nitrogen atoms. See Section 4.4.5 of the manual on how to plot this map.

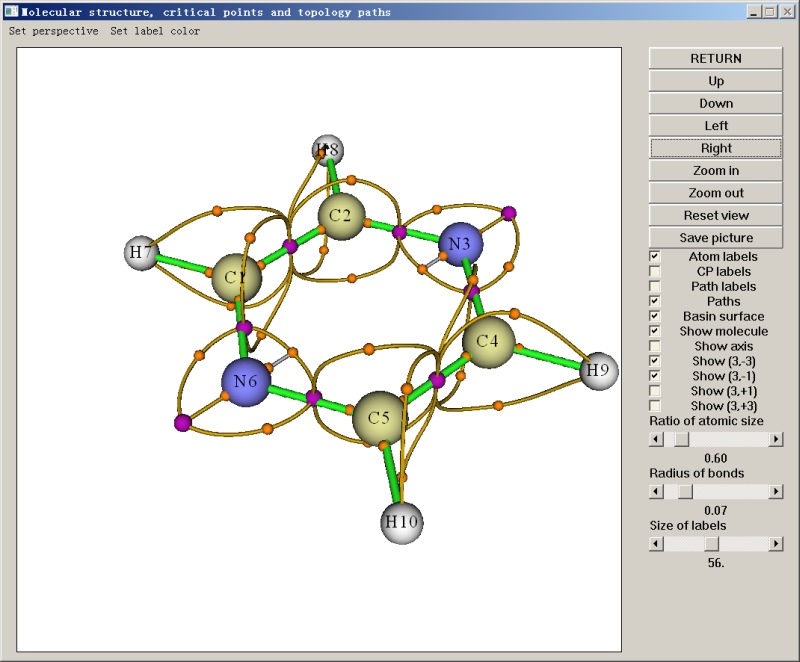
- Critical points and bond paths of electron density of imidazole-magnesium porphyrin complex. Some interbasin surfaces are shown as yellow surfaces. See Section 4.2.1 of the manual on how to plot this kind of map.

- (3, -3) and (3,-1) critical points and corresponding topology path of ELF of pyrazine. The purple spheres beside nitrogen atoms reveal the position of lone pairs, while the purple spheres between neighbouring atoms show that electrons are highly localized in the covalent bond regions. See Section 4.2.2 of the manual on how to carry out this kind of analysis.
- Spin density of triplet methanamide in the line defined by carbon and oxygen nuclear. See Section 4.3.1 of the manual on how to plot this map.

- Localized orbital locator (LOL) map of a small part of graphene, isovalue of the contour line is 0.5. The wavefunction of graphene primitive cell is calculated by PBC function of Gaussian, then Multiwfn is used to extend the wavefunction to periodic plane. See Section 4.6.3 of the manual on how to plot this map.

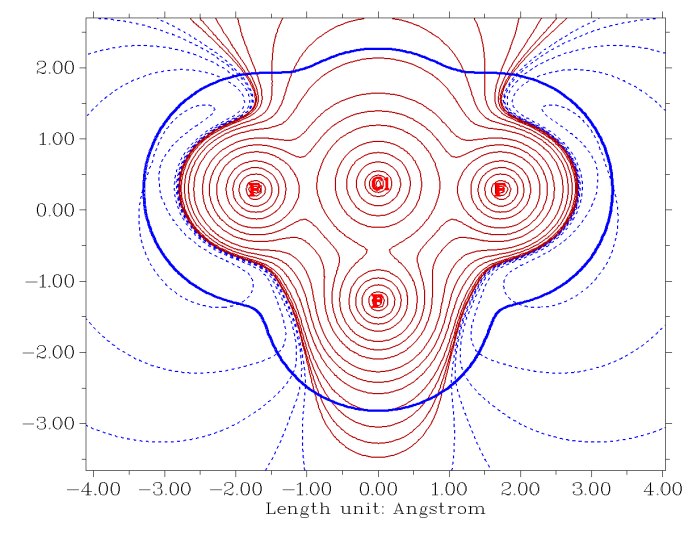
- Contour map of electrostatic potential of ClF3 in molecular plane, crimson and black lines correspond to positive and negative parts, respectively. The bold blue line portrays the van der Waals surface (electron density=0.001 a.u.). See Section 4.4.4 of the manual on how to plot this map.
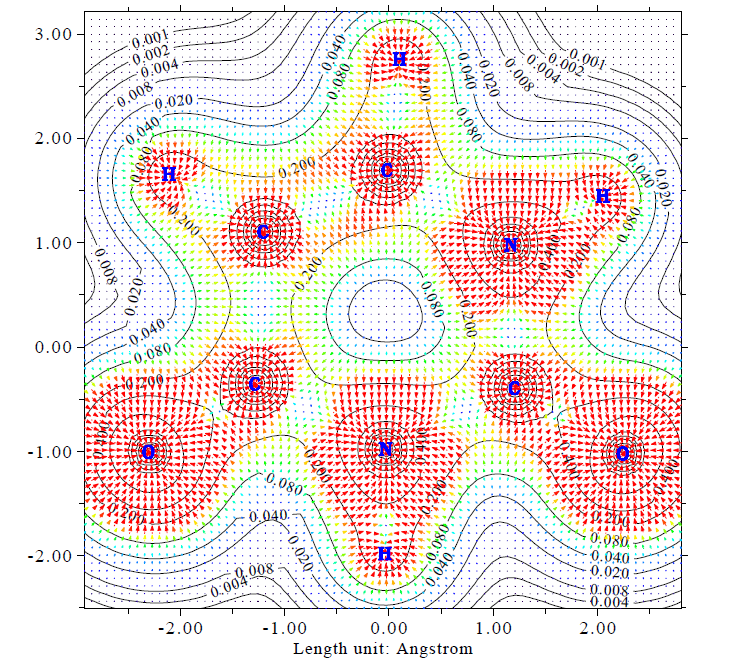
- Gradient vector field with contour lines of electron density of uracil in molecular plane. This map can be easily plotted via main function 4 of Multiwfn.
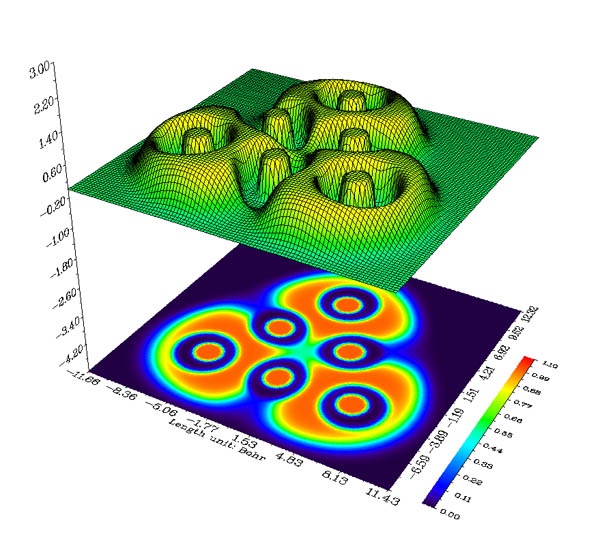
- Color-filled relief map with projection of electron localization function (ELF) of Li6 cluster. See Section 4.4.2 of the manual on how to plot this kind of map.
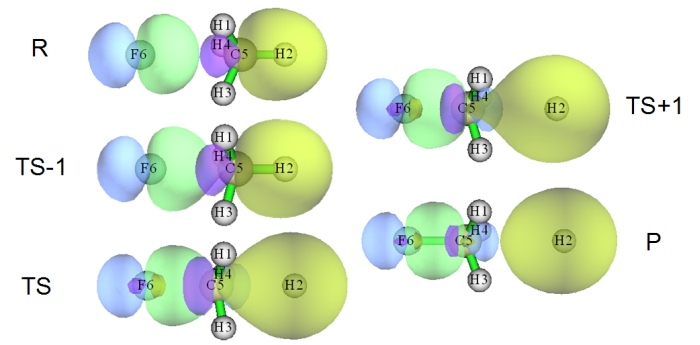
- Variation of localized molecular orbitals corresponding to the bonds to be formed (green-blue isosurface) and the bond to be broken (yellow-purple isosurface) during a SN2 reaction (R→TS-1→TS→TS+1→P). See Section 4.19.2 of the manual on how to reproduce this anaylsis.
Next Page