Pages: 1 2 3 4 5 6 7 8 9 10
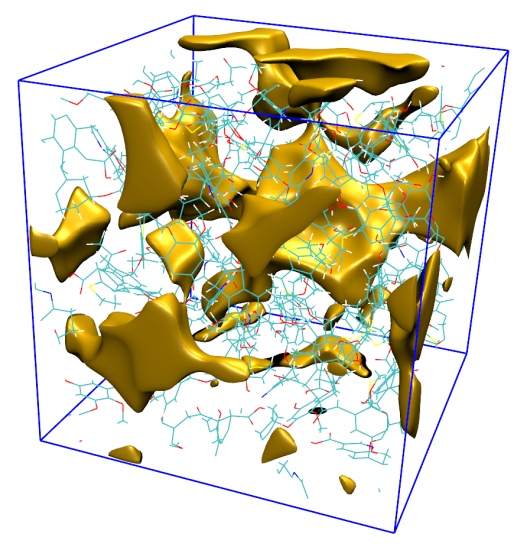
- Pores (free regions) in a frame of molecular dynamics simulation for coal. The grid data was generated by Multiwfn, the isosurface was rendered by VMD (which can also be directly visualized in Multiwfn). See Section 4.300.1 of manual on how to plot this map.
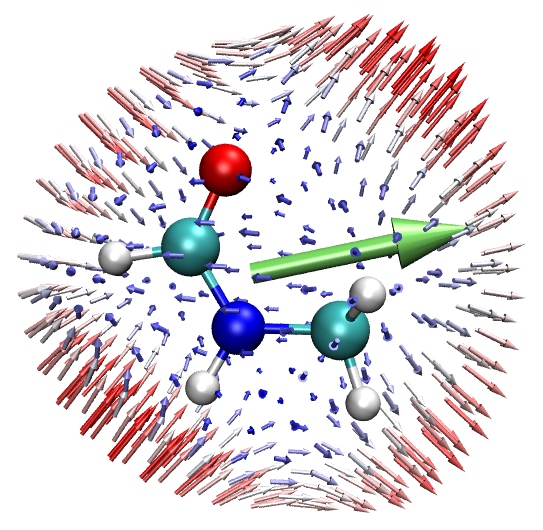
- Unit sphere representation and vector representation of first-order hyperpolarizability of CH3NHCHO. The map was rendered by VMD software while the plotting script was generated by Multiwfn. From this map one can clearly recognize anisotropic response of molecular dipole moment to external electric field. See Section 4.300.3 of manual on how to plot this map and related discussion.
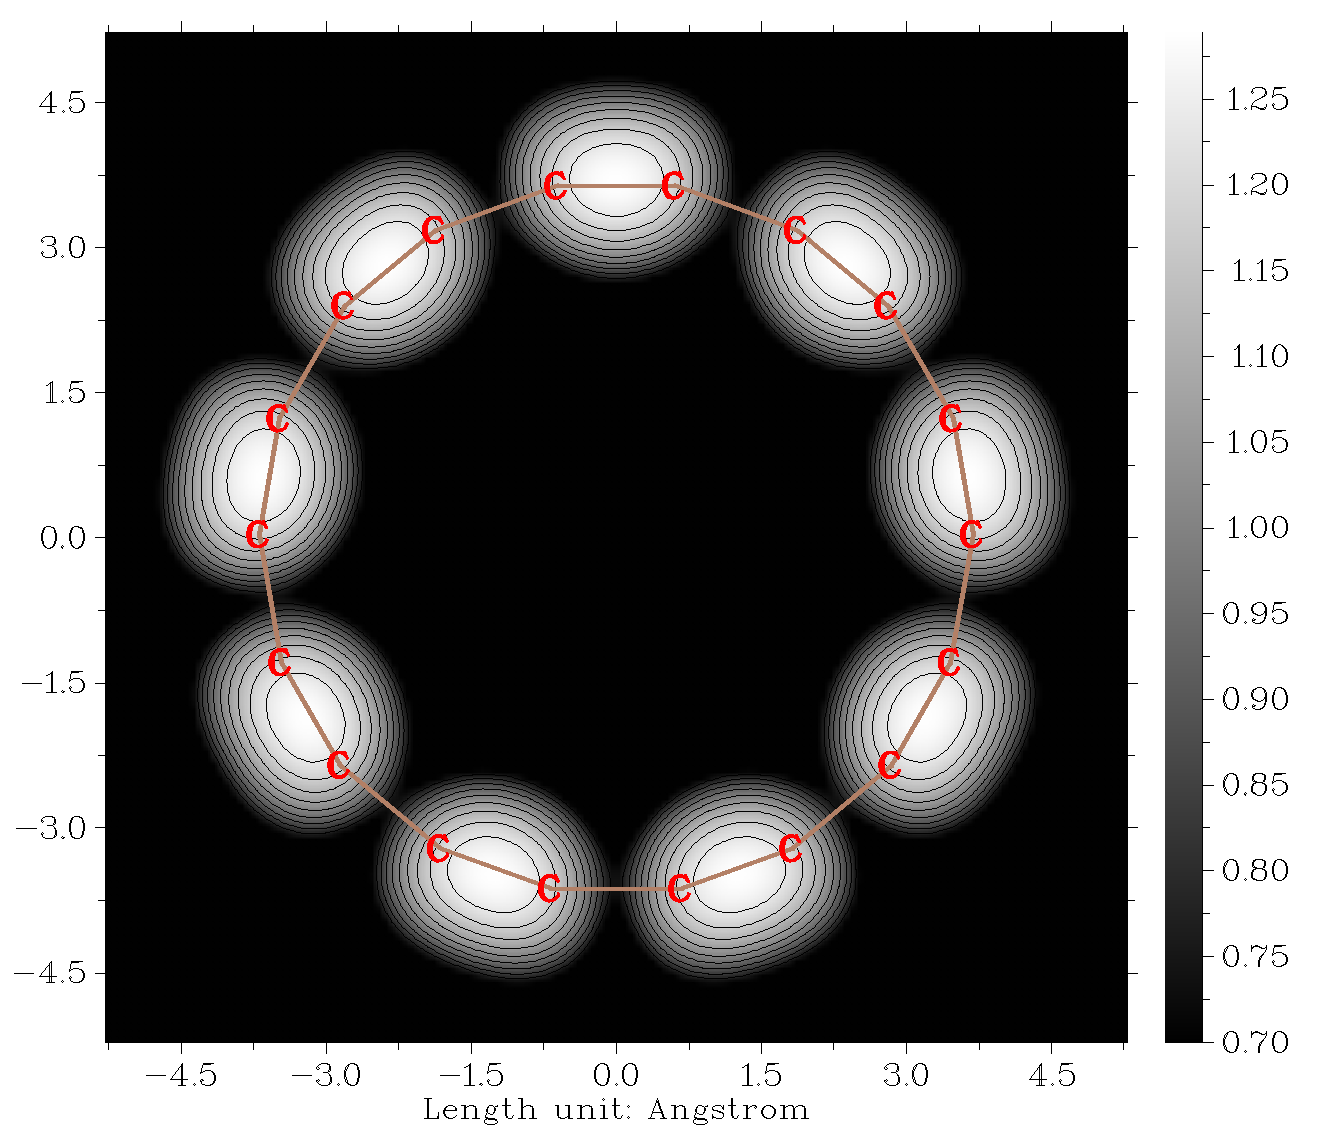
- Scanning tunneling microscopy (STM) image of constant current mode of cyclo[18]carbon at bias voltage of -3.5 V. The color scale represents the distance between the molecular plane and STM tip in Å. See Section 4.300.4 of manual on how to plot this kind of map.
- Dipole moment of the whole system (green arrow) and that of the two monomers (red and yellow arrows) calculated based on Hirshfeld partition of molecular density. See Section 4.15.3 of manual on how to plot this map.

- Conformation weighted 1H NMR spectrum for valine. See Section 4.11.10 of manual on how to plot this kind of map.

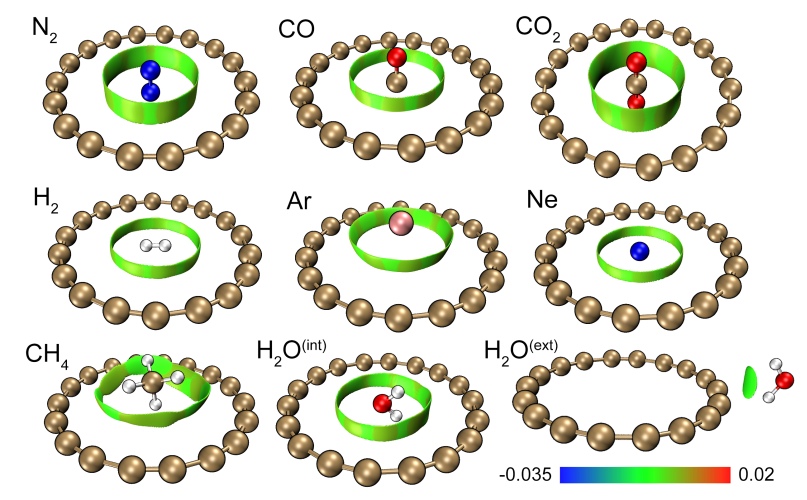
- Reduced density gradient (RDG) map of dimers formed between cyclo[18]carbon and various small molecules. See Carbon, 171, 514, (2021) DOI: 10.1016/j.carbon.2020.09.048 for detailed discussion. The interaction region between the cyclo[18]carbon and adsorbed small molecules can be clearly seen. See Section 3.23.1 on how to plot this kind of map.
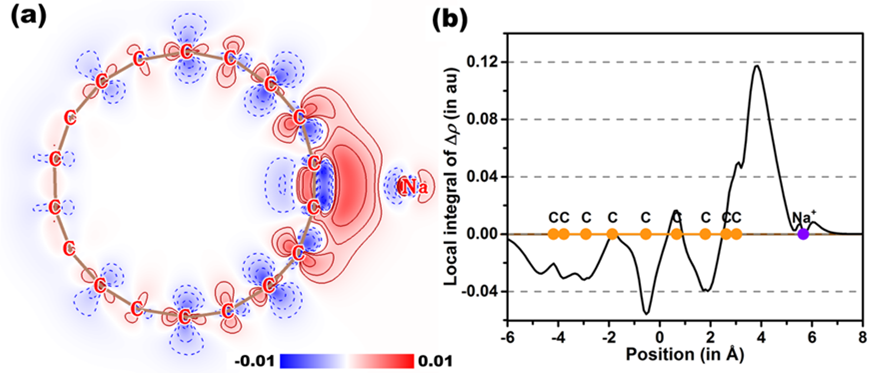
- Left: Electron density difference map defined as ρ(C18...Na+)-ρ(C18)-ρ(Na+), red and blue colors represent the regions where electron density is increased and decreased due to attachment of Na+ cation, respectively. See supplemental material of Carbon, 171, 514, (2021) DOI: 10.1016/j.carbon.2020.09.048 for detailed discussion. See Section 4.4.8 of manual on how to plot this type of map.
Right: Local integral of the electron density difference at different slices for better quantiative inspection. See section 4.13.6 on how to plot this kind of map (the data was exported by Multiwfn and then imported to Origin program for more flexible control of plotting effect)
- Isosurface map of electrostatic potential (ESP) of 0.001 a.u. of cyclo[18]carbon. Green and blue colors correspond to positive and negative isosurfaces. The value at global minimal point is labelled. See supplemental material of Carbon, 171, 514, (2021) DOI: 10.1016/j.carbon.2020.09.048 for detailed discussion. Main function 5 of Multiwfn was firstly used to generate cube file of ESP, then the map was rendered by VMD according to the procedure described in Section 4.A.14 of manual. The minima point was located by basin analysis module based on grid data of ESP.

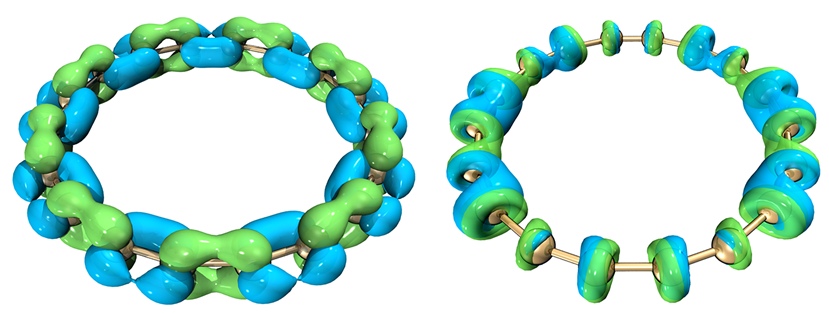
- Isosurface map showing hole (blue) and electron (green) distributions of cyclo[18]carbon. S0-S1 and S0-S21 excitations correspond to the left and right parts, respectively. See supplemental material of Carbon, 165, 461, (2020) DOI: 10.1016/j.carbon.2020.05.023 for detailed discussion. Hole-electron analysis module (subfunction 1 of main function 18) of Multiwfn was firstly used to generate cube file of hole and electron (see Section 4.18.1 of manual for example), then the map was rendered by VMD according to the procedure described in Section 4.A.14 of manual.
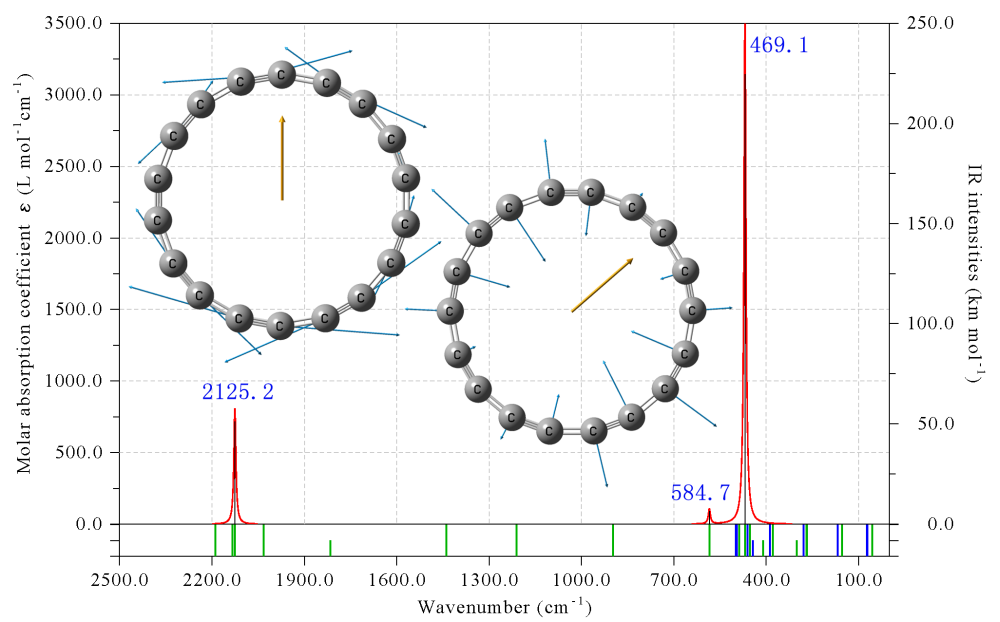
- IR spectrum of cyclo[18]carbon simulated by Multiwfn based on frequency analysis output file of Gaussian. The blue texts are directly labelled by Multiwfn used to indicate exact peak positions. The sticks at bottom clearly exhibit positions of vibration frequencies, and the heights indicate degeneracy (this system has many doubly degenerate modes), and the green and blue stick colors indicate in-plane and out-of-plane modes. It is obvious that the spectrum given by Multiwfn is able to convey very rich information (The insets are vibrational coordinates corresponding to the two strongest peaks plotted by other softwares). See Chem. Asian J., 16, 56 (2021) DOI: 10.1002/asia.202001228
for comprehensive study of vibrational spectra of cyclo[18]carbon.
Previous Page Next Page