Pages: 1 2 3 4 5 6 7 8 9 10
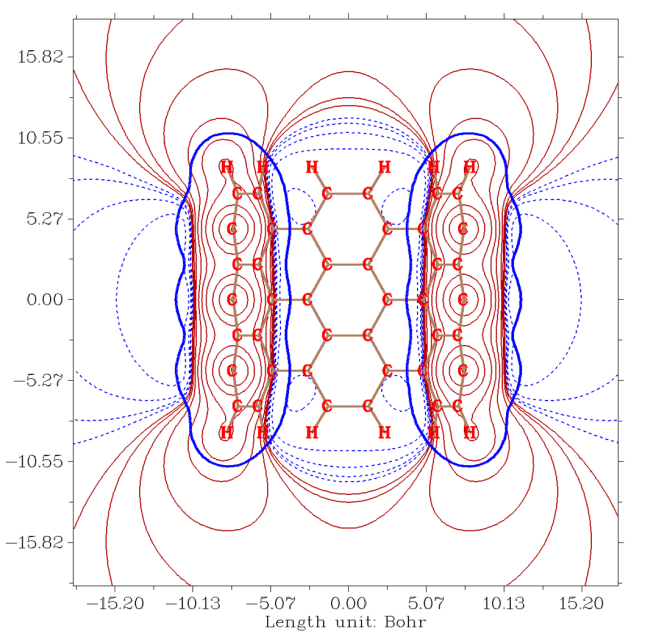
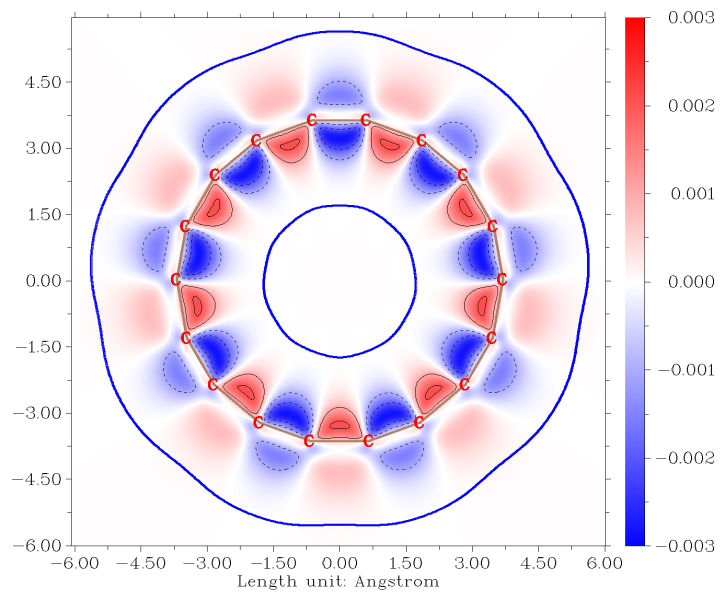
- Contour line map of electrostatic potential on clipping plane of a nanotube. Brown lines display chemical bonds. Crimson and black lines correspond to positive and negative parts, respectively. The bold blue lines portray the van der Waals surface (electron density=0.001 a.u.). See Section 4.4.4 of the manual on how to plot this kind of map.
- LOL map on Si6Li6 plane. See Section 4.4.1.2 of manual on how to plot this kind of map.

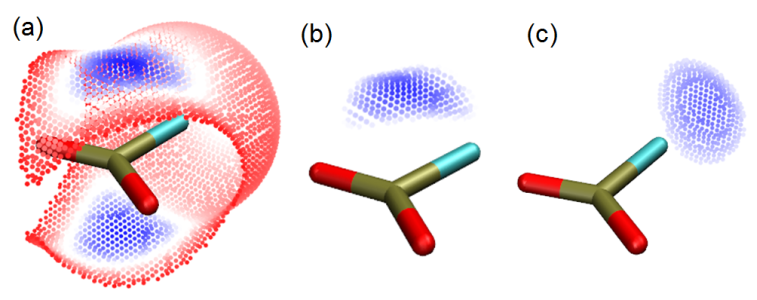
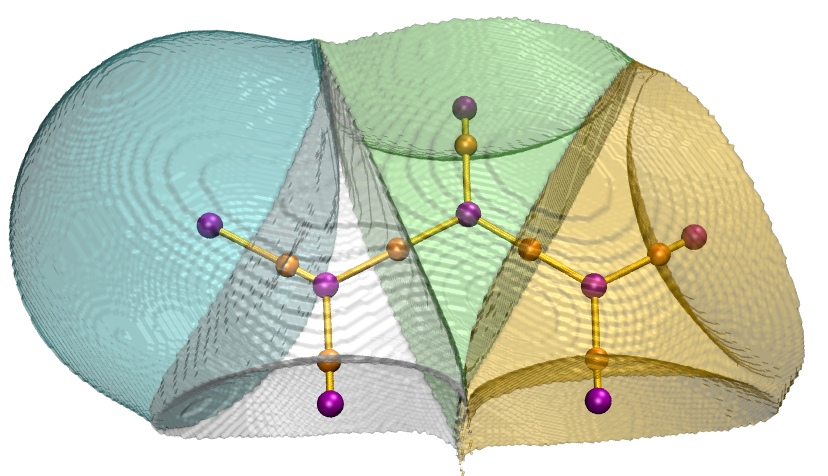
- Electrostatic potential (ESP) colored local van der Waals surface of featured region of ClPO2, the color scale is 0.0~0.08 a.u. for (a) and (b), 0~0.05 a.u. for (c). See Section 4.12.10 on how to plot the graph and calculate the data. (a) Positive ESP region around π-holes, area=55.9 Å2, ESPavg=0.0265 a.u. (b) ESP>0.04 a.u. region around a π-hole, area=3.6 Å2, ESPavg=0.05772 a.u. (c) ESP>0.03 region around σ-hole, area=4.9 Å2, ESPavg=0.03617 a.u.
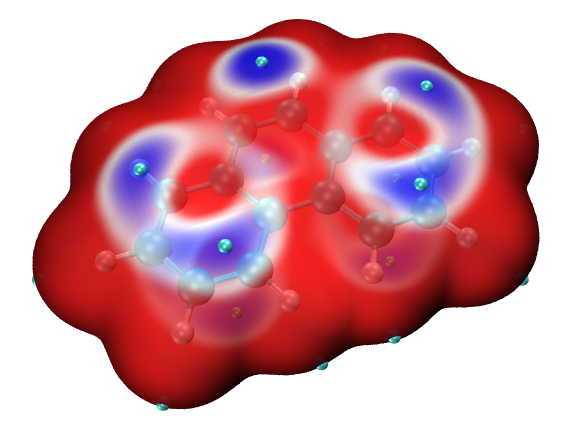
- Average local ionization energy (ALIE) colored molecular surface map of phenanthrene. The data were calculated by Multiwfn while the map was rendered by VMD. The cyan spheres correspond to surface minimum of ALIE. The blue color highlights the regions having relatively low ALIE value, where are favorable sites for electrophilic attack. See Section 4.12.2 of manual on how to easily plot this kind of map.
- Electronic circular dichroism (ECD) spectrum of asparagine. See Section 4.11.3 of Multiwfn manual on how to plot this kind of map. The blue labels indicate X-axis position of minima and maxima of the curve, the spikes at bottom highlight position of the transition levels. As illustrated in Section 4.11.9, the color of the spikes can be used to distinguish type of transitions while spike height can be used to vividly exhibit transition degeneracy.

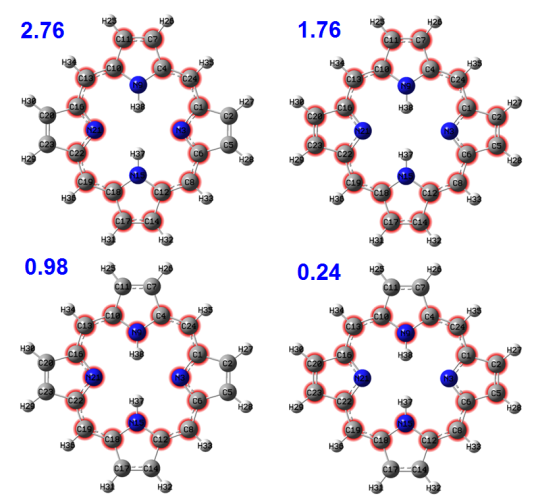
- AV1245 index of four possible delocalization paths of porphyrin. The ring shown in the upper left corner of the below figure has the strongest aromaticity because the corresponding AV1245 is the largest. See Section 4.9.11 on how to calculate AV1245 index.
- Atomic basins (also known as AIM basins) of four non-hydrogen atoms of acrolein. See Section 4.17.1 of Multiwfn manual on how to plot it. Corresponding video
tutorial is also available: https://youtu.be/9D5do80XcbI.
- Electron localization function (ELF) isosurface map of acetic acid plotted by ChimeraX based on cube file generated by Multiwfn. The way of plotting this map is illustrated in this video tutorial: https://youtu.be/vC48iEB8PwI.

- Color-filled map of orbital-weighted dual descriptor of cyclo[18]carbon on molecular plane, see Section 4.100.16.2 of manual on how to plot it.
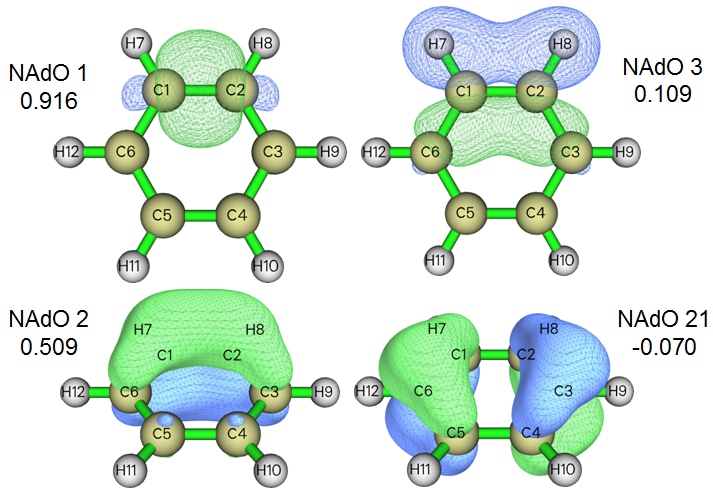
- Isosurface map of four representative natural adaptive orbitals (NAdOs) of benzene. The values are eigenvalues of NAdOs and correspond to orbital contribution to delocalization index. Clearly NAdO analysis unveils the nature of delocalization index (or more generally, bond order) in a quite clear and intuitive way. See Section 4.200.20 of manual on how to plot this kind of map.
Previous Page Next Page