Pages: 1 2 3 4 5 6 7 8 9 10
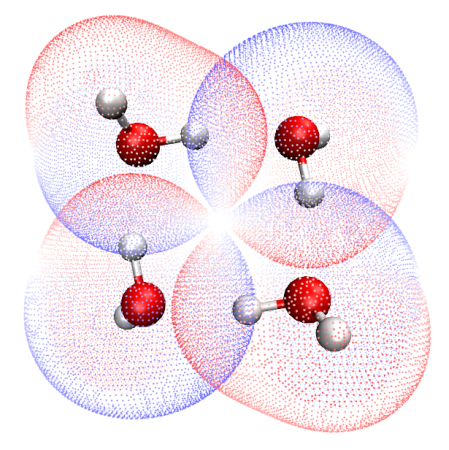
- Electrostatic potential (ESP) colored vdW surface of each water monomer in the water tetramer configuration. Penetration of vdW surfaces and electrostatic complementation effect can be clearly seen. Positive and negative ESP were rendered as red and blue, respectively. VMD was used to plot the graph based on outputted file of quantitative molecular surface analysis module of Multiwfn. See Section 4.A.13 of Multiwfn manual on how to plot such a map.
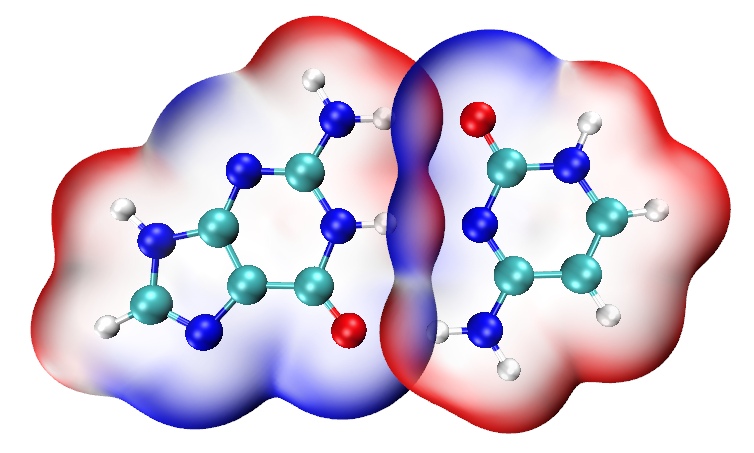
- This graph shows penetration of van der Waals surfaces of guanine and cytosine. The ESP is mapped on isosurface of electron density. See Section 4.A.13 of Multiwfn manual on how to plot such a map.
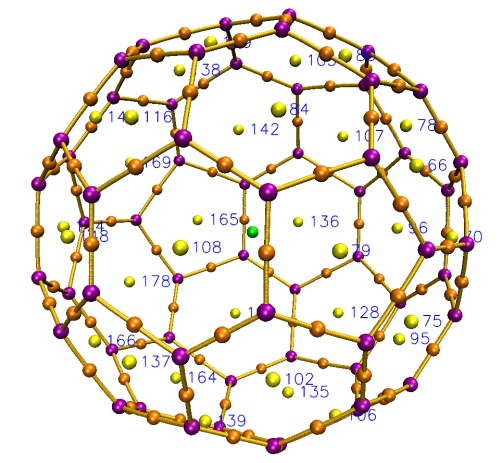
- This graph shows AIM critical points and topology paths, indices of (3,+1) CPs are labelled. The graph was plotted by VMD based on output file of topology module of Multiwfn. See Section 4.2.5 of Multiwfn manual on how to plot such a graph.
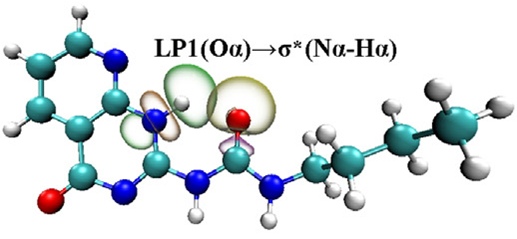
- This graph exhibits hyperconjugation between two NBO orbitals. The map was plotted by VMD based on outputted cube file of Multiwfn, the NBO orbitals were generated by Weinhold's NBO program. See Section 4.0.2 of Multiwfn manual for detail.
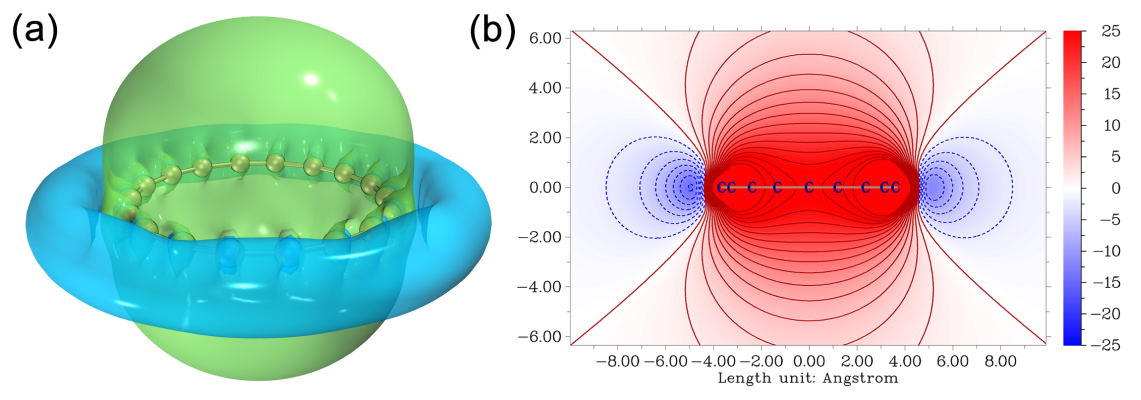
- Isosurface map of Z component of the second hyperpolarizability density (-zρZZZ(r)), the integral of this function over the whole space corresponds to the ZZZZ component of the second hyperpolarizability (γZZZZ), therefore from this map one can clearly recognize which region has evident contribution to γZZZZ. See Section 3.27.3 of Multiwfn manual for introduction of this kind of analysis and Section 4.24.3 for examples.

- Isosurface map and color-filled plane map of ZZ type of iso-chemical shielding surface (ICSSZZ) of cyclo[18]carbon, see Carbon, 165, 468 (2020) DOI: 10.1016/j.carbon.2020.04.099 for detailed discussion of this map. ICSS is particularly useful for discussing aromaticity, see Section 3.28.3 of the manual for introduction and Section 4.25.3 on how to plot this kind of map. The ICSS can also be easily plotted as curve map in Multiwfn.
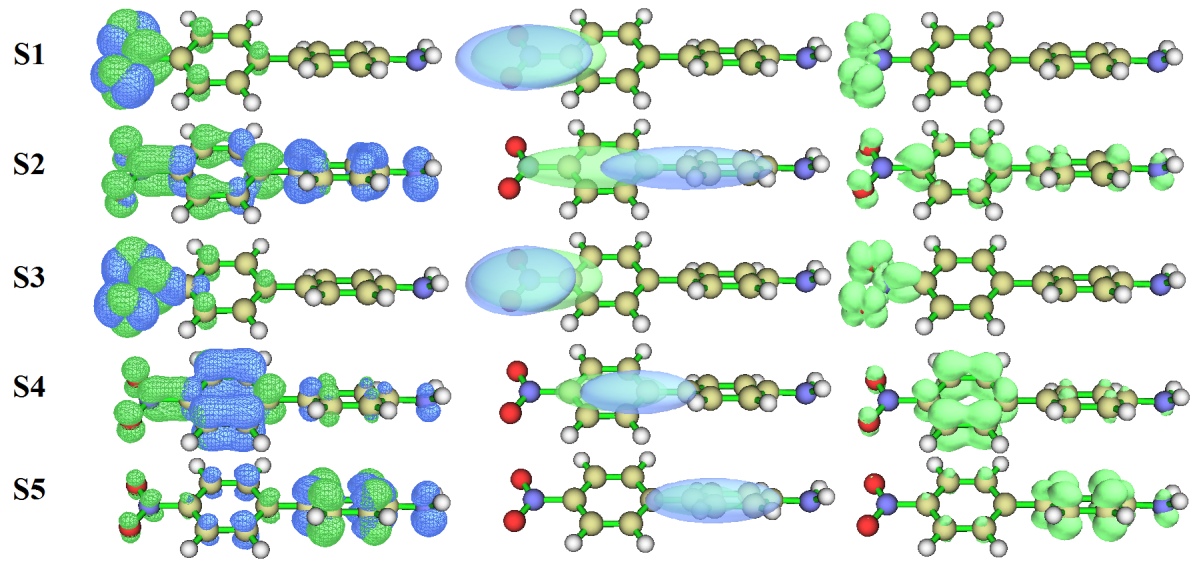
- Various functions yielded by hole-electron analysis module of Multiwfn for NH2-biphenyl-NO2, they are extremely useful for characterizing electron excitations. See Section 4.18.1 on how to carry out the very powerful hole-electron analysis.
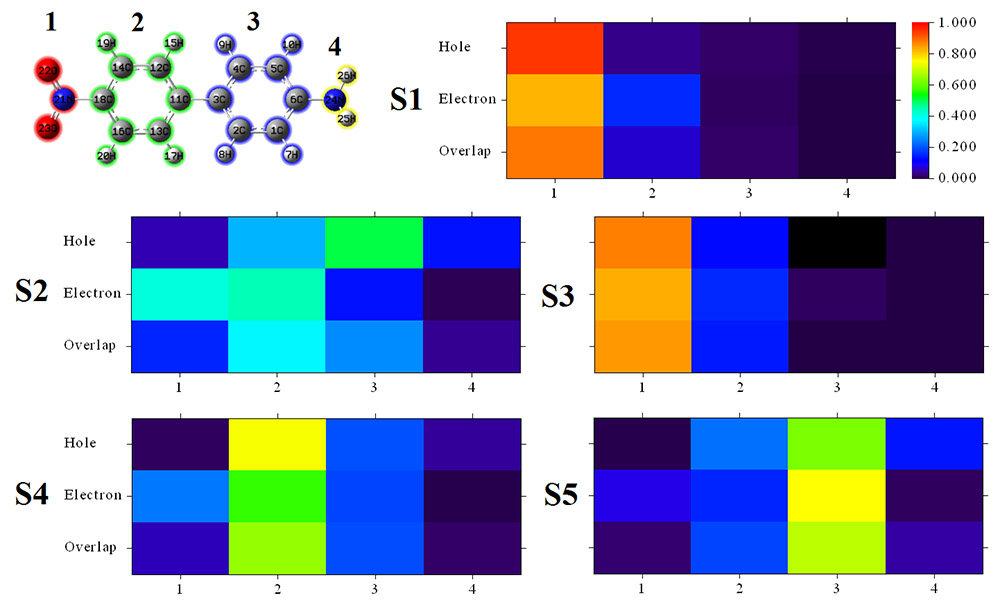
- Hole-electron isosurface map (corresponding to the S4 case show above) rendered by VMD based on cube files exported by Multiwfn. See Section 4.A.14 on how to very easily realize this effect.

- Below heat map exhibits contribution of various molecular fragments to hole and electron of different electron exctations of NH2-biphenyl-NO2, this map is comparable with the above map. See Section 4.18.1 on how to plot.
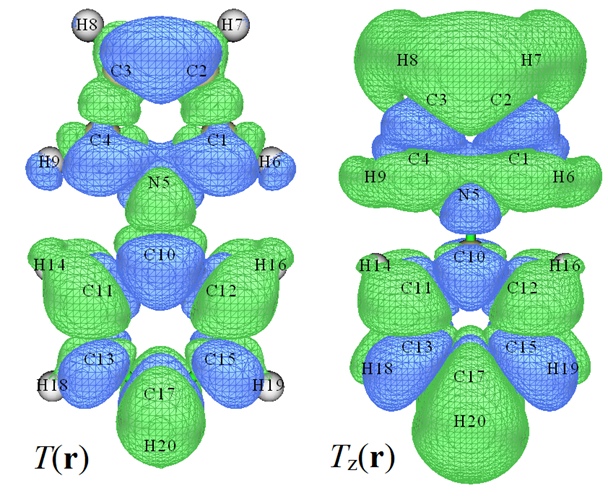
- Transition density T(r) and Z component of transition dipole moment density TZ(r) of N-phenylpyrrole, they are important for understanding the nature of electron excitations. Via the former one can recognize where coherence between hole and electron is evident, while the latter reveals contribution of transition dipole moment at various local regions. See Section 4.18.2.1 of the manual on how to carry out this analysis.
Previous Page Next Page