Multiwfn forum
Multiwfn official website: http://sobereva.com/multiwfn. Multiwfn forum in Chinese: http://bbs.keinsci.com/wfn
You are not logged in.
- Topics: Active | Unanswered
Pages: 1
#1 Re: Multiwfn and wavefunction analysis » Local integration of electron density » 2024-04-17 10:19:19
Dear Dr. Tian Lu,
Thank you very much for confirming my concerns about the ETS-NOCV analysis.
I will try to use the BOD/NAdO need method you proposed to analyze the interaction.
Best regards,
Eugene
#2 Multiwfn and wavefunction analysis » Local integration of electron density » 2024-04-16 12:40:50
- Quark
- Replies: 2
Dear Dr. Tian Lu,
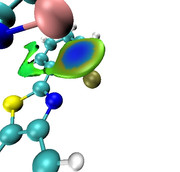
I am trying to study non-covalent interactions between O and S atoms within a single molecule. However, I am encountering an issue with integrating the electron density, as I cannot find the NOCV pair associated solely with this interaction. Consequently, the density of the entire NOCV pair is integrated, leading to an overestimation of the number of participating electrons. The image suggests that there is no electron density between the O and S atoms, yet the CDF curve indicates otherwise. If there is a way to integrate the electron density along the Z direction for selected atoms only, without considering the rest of the electron density of the molecule.
I would be deeply grateful to you for any comments.
--
Best regards,
Eugene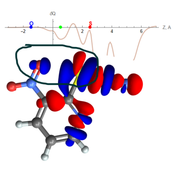
#3 Re: Multiwfn and wavefunction analysis » Problem with plotting 2D IGMH plot » 2022-02-25 18:45:33
Dear Prof Lu,
Thank you very much for your valuable comments.
--
Best regards,
Eugene
#4 Multiwfn and wavefunction analysis » Problem with plotting 2D IGMH plot » 2022-02-24 22:41:09
- Quark
- Replies: 2
Dear Prof Lu,
In my research, I often use IGMH to analyze and visualize non-covalent interactions, both isosurface and 2D plot delta-g_inter vs. sign(lambda2)rho. However, not long ago I encountered a problem in building a 2D plot. In my opinion, the 2D IGMH plot looks wrong, whereas the IGMH blue isosurface looks great. I tested different versions of Multiwfn, however, I got the same result. I have previously used IGMH to analyze a similar interaction. No such problems were observed. Unfortunately, I can't understand why the 2D IGMH plot looks like this for a given interaction.
I would be very grateful to you for any comments.
--
Best regards,
Eugene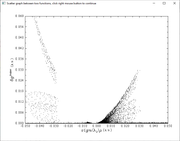
#5 Re: Quantum Chemistry » Plotting a Charge Displacement Curve » 2021-03-10 00:50:09
Dear Professor Tian Lu,
Thanks a lot for your help.
I was able to successfully plot the graph for the test molecule I3 but ran into a problem when plotting the CD for he molecule under investigation.
Unfortunately, I cannot understand on which axis I need to integrate, what to study the charge transfer of the M-M-donor contact?
To calculate the CD plot, it is required to integrate along the Z-axis. In the calculation, the Orca program orientates the molecule in an arbitrary direction (Fig. a). Please tell me if it is possible to reorient the molecule so that the analyzed contacts M-M-donor were located on the Z-axis (Fig. b) for calculating the CD plot.
How to get coordinates of atoms for CD curve?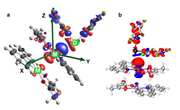
Best regards
Eugene
P.s.:
Thank you for pointing to your new interesting work. I will certainly quote this article in work on the study of non-covalent interactions.
#6 Quantum Chemistry » Plotting a Charge Displacement Curve » 2021-03-08 18:16:28
- Quark
- Replies: 12
Dear Professor Tian Lu,
In my study, there is a need to analyze changes in charge transfer. I would like to use the Charge Displacement function (CD), which allows you to analyze and visualize changes in charge transfer. However, I cannot figure out how to plot the CD.
As indicated in the article, it is necessary to construct an electron density difference map and integrate it along the z-axis.
"To make the picture of the bonding which emerges from the density difference plots more quantitative, we show, below each one, the curve representing the partial integral of the density difference along the internuclear axis. This thus measures the actual electronic charge fluctuation with respect to the isolated fragments, as one moves from left to right along the internuclear axis (z) and is defined as follows:
where Δq, is the electron density of the complex minus that of the two isolated fragments. The red dots on the curves in Figures mark the nuclear positions, while the dashed vertical line marks the fragment boundary defined earlier. DOI:10.1021/ja0772647, 10.3390/molecules25020300"
Tell me, please, how do I integrate the electronic density difference map with Multiwfn?
I managed to construct a 1D map of the electronic density difference as specified in detail in the manual to Multiwfn. But I can't figure out how to integrate?
I really hope that such a useful function will appear in the future in the Multiwfn program.
Thank you in advance for your answers.
--
Best regards
Eugene
#7 Re: Quantum Chemistry » Calculation of the energy of the halogen bond » 2021-01-30 00:20:10
Dear Professor Tian Lu,
Thank you for dispelling doubts
--
Best regards
Eugene
#8 Quantum Chemistry » Calculation of the energy of the halogen bond » 2021-01-28 01:43:46
- Quark
- Replies: 2
Dear Professor Tian Lu,
In my study, I need to calculate the energy of the halogen bond Cl-O. (Figure1). To do this, I used the SAPT method. According to calculations, the energy of interaction between fragments is estimated at -4.4 kcal/mol. The results of energy decomposition show that long-range interactions (electrostatic and dispersion attraction interactions) prevail. In order to calculate the halogen bond energy, a model calculation was made where halogen atoms were replaced by hydrogen atoms, thus the distances between oxygen and hydrogen atoms are greater than the Van der Waals radius.(Figure3) Thus, the energy between the model fragments was -2.5 kcal/mol. Is it true that the energy of the halogen bond is the difference between the energy of the fragments with the halogen bond and the model system?
(-4.4 + 2.5) / 2 = -0.95 kcal/mol the energy of the halogen bond Cl-O.
Can it be said that the dimer is mainly retained by halogen bonds Cl-O and long-range interactions?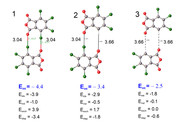
Thank you in advance for your answers.
--
Best regards
Eugene
#9 Re: Quantum Chemistry » ESP of a charged molecule » 2020-11-16 01:37:27
Dear Dr. Tian Lu,
Thanks for answering my questions.
Best regards
Eugene
#10 Re: Quantum Chemistry » ESP of a charged molecule » 2020-11-16 00:38:03
Dear Dr. Tian Lu,
Thank you very much for your reply. As for my first question, I cannot understand the algorithm for constructing surfaces ESP for charged molecules. If I use the whole molecule [A- and K +], then I have a single ESP surface covering part of the K+ molecule. Please tell me how I can build two surfaces ESP separate for ions A- and K +. Should I optimize separately anion and cation or the whole molecule [A- and K +], and then make single calculations of the wave function for the obtained geometry of anions and cations? Thus, I planned to evaluate the sigma holes on the iodine atom
Best regards
Eugene
#11 Quantum Chemistry » ESP of a charged molecule » 2020-11-15 00:04:50
- Quark
- Replies: 8
Dear Dr. Tian Lu,
I would be grateful if you answer my questions
How to build ESP for a charged molecule? Is it correct to optimize the whole molecule, and to use separate cation and anion to calculate the ESP surface? As far as I know, the basis function should contain diffuse functions, so I plan to use PBE0 dеf2-TZVPD to calculate ESP. However, for optimization, can I use a def2-TZVP to shorten the computation time?
Best regards
Eugene
#12 Re: Multiwfn and wavefunction analysis » Hessian lambda2 » 2020-07-25 15:55:27
Dear Dr. Tian Lu,
Thank you very much for your help
--
Best regards
Eugene
#13 Multiwfn and wavefunction analysis » Hessian lambda2 » 2020-07-25 11:29:08
- Quark
- Replies: 2
Dear Dr. Tian Lu,
Please tell me why the calculated value of the Hessian lambda2 for critical points 121 and 190 is not negative if the value Sign(lambda2) * rho is negative? I understood correctly that lambda2 is the second Eigenvalues of Hessian?
Thank you in advance for your answers.
--
Best regards
Eugene
#14 Re: Multiwfn and wavefunction analysis » Generating 47 files NBO from Multiwfn » 2020-06-24 23:52:10
Dear Dr. Tian Lu,
I took your advice and purchased NBO7.
Thank you for your assistance!
--
Best regards
Eugene
#15 Multiwfn and wavefunction analysis » Generating 47 files NBO from Multiwfn » 2020-06-24 15:29:18
- Quark
- Replies: 6
Dear Dr. Tian Lu
I study non-covalent interactions, so I need to calculate the NBO analysis of E2. For calculations, I use Orca 4.2.0 and Multiwfn_3.7 jun.
According to the Multiwfn manual, the Orca wave function in the .gbw file can be converted to * 47 format for GENNBO. However, the resulting file *47 does not contain the% FOCK section for calculating E2, and the resulting files *31-42 cause the Multiwfn to crash.
I also used the Molden2AIM- https://github.com/zorkzou/Molden2AIM to generate 47 files, but the program reports errors in the formation of the Fock matrix. NBO graphic files are also not readable by Multiwfn.
"
Sum of MO Occupancies = 824.0000000000
Analytically integrated number of electrons = 824.0000001527
Difference = 0.0000001527
Difference per atom = 0.0000000014
Error of orthogonality in C^T * S * C - I = 0.0004543759 (o)
0.0006991327 (d)
### Warning! ChkOrtho fails.
Do not use the $FOCK data for Second-Order Perturbation Theory analysis. "
Unfortunately, files larger than 5 MB are therefore unable to attach to my message.
Please tell me, is it possible to get the Fock matrix from Orca using Multiwfn?
Are there any ways to get the *47 file from the wave function without recounting?
Thank you in advance for your answers.
--
Best regards
Eugene
Pages: 1