Multiwfn forum
Multiwfn official website: http://sobereva.com/multiwfn. Multiwfn forum in Chinese: http://bbs.keinsci.com/wfn
You are not logged in.
- Topics: Active | Unanswered
#1 2022-02-24 22:41:09
- Quark
- Member
- Registered: 2020-06-24
- Posts: 15
Problem with plotting 2D IGMH plot
Dear Prof Lu,
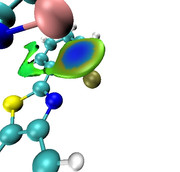
In my research, I often use IGMH to analyze and visualize non-covalent interactions, both isosurface and 2D plot delta-g_inter vs. sign(lambda2)rho. However, not long ago I encountered a problem in building a 2D plot. In my opinion, the 2D IGMH plot looks wrong, whereas the IGMH blue isosurface looks great. I tested different versions of Multiwfn, however, I got the same result. I have previously used IGMH to analyze a similar interaction. No such problems were observed. Unfortunately, I can't understand why the 2D IGMH plot looks like this for a given interaction.
I would be very grateful to you for any comments.
--
Best regards,
Eugene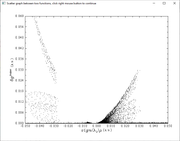
Last edited by Quark (2022-02-24 22:48:36)
Offline
#2 2022-02-25 02:16:37

Re: Problem with plotting 2D IGMH plot
Dear Eugene,
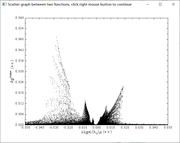
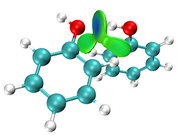
There should be no problem in the Multiwfn code. For example, the scatter map and isosurface map for phenol dimer look very normal.
Your scatter map is not necessarily wrong. In the interaction region the blue is fairly deep, implying that the rho in that region is relatively large. If you decrease the lower limit of X-axis of the scatter map, possibly the peak can be viewed more sufficiently.
Best regards,
Tian
Offline
#3 2022-02-25 18:45:33
- Quark
- Member
- Registered: 2020-06-24
- Posts: 15
Re: Problem with plotting 2D IGMH plot
Dear Prof Lu,
Thank you very much for your valuable comments.
--
Best regards,
Eugene
Offline