Multiwfn forum
Multiwfn official website: http://sobereva.com/multiwfn. Multiwfn forum in Chinese: http://bbs.keinsci.com/wfn
You are not logged in.
- Topics: Active | Unanswered
- Index
- » Search
- » Posts by Hans
Pages: 1
#1 Multiwfn and wavefunction analysis » Extract coordinates from fragments in batches » 2022-05-04 23:44:20
- Hans
- Replies: 1
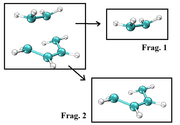
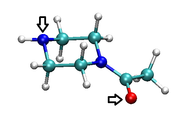
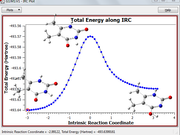
Best regards. I want to make use of the sub function 0 (custom operation) of the main function 5 (calc. grid data) of Multiwfn for each point of a reaction coordinate, my problem is to extract the coordinates of the fragments from a file containing the coordinates of the molecular system for each point of the IRC (for example from a xyz format file), see attached image.
I tried to do this using BATCH commands, but I am not very good at this. I don't know if you could provide me with a suitable BATCH program for this purpose.
PS: I am a Windows user only.
Thanks in advance.
#2 Multiwfn and wavefunction analysis » Transparent images using VMD » 2022-02-07 17:17:26
- Hans
- Replies: 1
Hello.
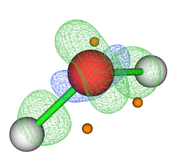
Using Multiwfn it is possible to get transparent images by setting itransparent=1 in settings.ini.
I am wondering if it is possible to get transparent images using the VMD program.
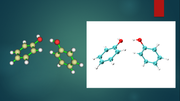
For example, to the left of the attached image is an image with transparency obtained with Multiwfn, and to the right is an image obtained with VMD.
I can't find a way to get an image with transparency using VMD. Could you tell me if this is possible?
#3 Re: Multiwfn and wavefunction analysis » Topological analysis of the electron density difference » 2021-08-02 01:57:08
it's correct thanks
#4 Multiwfn and wavefunction analysis » Topological analysis of the electron density difference » 2021-08-01 18:07:37
- Hans
- Replies: 2
I want to perform the topological analysis of the electron density difference (for example, of the water molecule). I previously placed the .wfn files in the Multiwfn directory as indicated in the manual, the steps I performed are as follows:
I execute the file water.fch in Multiwfn
iu //
-1 // I'm not sure here if I should use this option or the user-defined option "-3", then I continue:
5// data grid
-2// deformation property
1// electron density
3// high quality grid
0// return
2// topology analysis
-11// select function
100// user-defined function
6//
11// points in the sphere
6000//
-1// each nucleus in turn
-9// return
-10// return main menu
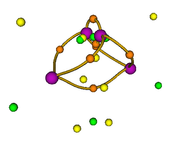
Then with the main option "13" I visualize the CPs and the isosurface (see Fig. 1). My question is whether this sequence of steps is correct for this type of analysis since the poincare-hopf relationship is not satisfied.
#5 Multiwfn and wavefunction analysis » Atom colors and Cue Mode effect in VMD » 2021-05-18 15:43:39
- Hans
- Replies: 6
When viewing the molecular structure in VMD, it shows the atoms with default colors (eg Nitrogen from blue and oxygen from red), my question is is it possible to change these default colors in VMD to other custom colors? Is it possible to do this by means of a script? (Fig. 1).
Another problem that I have when visualizing a molecule in VMD is that when applying the PERSPECTIVE effect and additionally the CUE MODE-LINEAR effect, I do not obtain this last effect in the visualization of the molecule (Fig. 2), the values that I use for this effect they are Cue Start = 1.5 and Cue End = 2.75, I tried various values but did not get the desired effect.

#6 Multiwfn and wavefunction analysis » Tcl script in VMD » 2021-05-15 19:23:26
- Hans
- Replies: 4
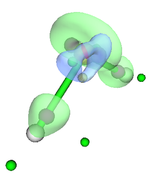
Using a VMD script written by me (IGMinter_isoall.tcl) I try to visualize the behavior of dginter in the course of a reaction (Fig. 1), but the VMD script does not work correctly. Could you check the IGMinter_isoall.tcl script and correct it?
I wrote the IGMinter_isoall.tcl script according to what is indicated in section 4.20.10.2 of the Multiwfn Manual
In RG I attach the files if necessary:
https://www.researchgate.net/post/Tcl_script_in_VMD
---IGMinter_isoall.tcl------------------------------------------------------------------------------------------------
set nsystem 51
set isovaldginter 0.01
set colordginter 7
set colorlow -5.0
set colorhigh 5.0
for {set i 1} {$i<=$nsystem} {incr i} {
set name SP[format %04d $i]
puts "Processing atmdg_$name.pdb and dg_inter_$name.cub..."
display projection Orthographic
display rendermode GLSL
display depthcue off
light 2 on
light 3 on
color Display Background white
axes location Off
color scale method BWR
mol default style CPK
mol new atmdg_$name.pdb
mol new dg_inter_$name.cub
mol modstyle 0 top CPK 1.0 0.8 18.0 16.0
mol modcolor 0 top Beta
mol modmaterial 0 top EdgyShiny
mol scaleminmax 0 top $colorlow $colorhigh
mol modstyle 0 1 Isosurface $isovaldginter 0 0 0 1 1
mol modcolor 0 1 ColorID $colordginter
mol modmaterial 0 1 EdgyGlass
render snapshot $name.bmp
mol delete top
mol delete top
}
#7 Quantum Chemistry » Set the width and height of the OpenGL window of the VMD program » 2021-05-05 21:17:47
- Hans
- Replies: 1
When executing the VMD program, the OpenGL display window appears with a default height and width, what I want is to change these default values so that each time I run the VMD program the OpenGL window has the height and width that I assign previously. How do I make this setting in VMD?
#8 Re: Quantum Chemistry » rotate a molecule and visualize the RDG in VMD using script » 2021-05-05 17:32:54
ok, could you also answer the question related to the RDG plot posted on researchgate? It has several additional files, it is for this reason that I do not post it here
#9 Quantum Chemistry » rotate a molecule and visualize the RDG in VMD using script » 2021-05-05 15:20:17
- Hans
- Replies: 3
I want to make a molecule rotate on one of its axes (either up / down / right / left) by pressing a button on the keyboard (preferably one of the directional buttons) (see fig. 1). I think this would be possible using a script, but I don't know how to write that file.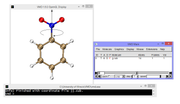
this and about the visualization of the RDG I posted it on researchgate but I can't find an answer:
#10 Quantum Chemistry » How to run a RELAXED SCAN in Gaussian 09? » 2021-05-05 15:04:09
- Hans
- Replies: 1
I want to perform a RELAXED SCAN calculation between 12-crown-4 and lithium cation in Gaussian 9 consisting of the following:
As a starting point, placing the Li+ at a distance of 0.4 Å from the center of 12-crown-4 to a distance of 5.4 Å from said center as the end point of the calculation, with 0.4 Å increments (Fig. 1).
In other words, I want to perform the relaxed scan calculation by placing the Li+ at a slightly different distance from the center of the 12-crown-4 (this for symmetry reasons, to avoid a reorientation of the molecular system in the course of the calculation) up to a distance farthest from the ring. The problem I have is that I don't know how to type or what keywords should I use in Gaussian 9's .gjf file to run this calculation.
I attach the optimized geometry at the hf/3-21g level in salt.gjf (it is D2d symmetry).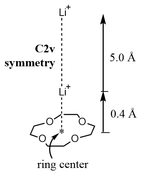
%chk=C:\salt.chk
# hf/3-21g
Title Card Required
1 1
Li 0.00000000 0.00000000 0.00000000
O 1.80378214 -0.00000000 0.32927408
C 2.30761918 1.26176110 -0.19253296
C 2.30761918 -1.26176110 -0.19253296
C 1.26176110 2.30761918 0.19253296
C 1.26176110 -2.30761918 0.19253296
O 0.00000000 1.80378214 -0.32927408
O -0.00000000 -1.80378214 -0.32927408
C -1.26176110 2.30761918 0.19253296
C -1.26176110 -2.30761918 0.19253296
C -2.30761918 1.26176110 -0.19253296
C -2.30761918 -1.26176110 -0.19253296
O -1.80378214 -0.00000000 0.32927408
H 3.26664225 1.49572411 0.24426407
H 2.39390318 1.19789109 -1.26923404
H 3.26664225 -1.49572411 0.24426407
H 2.39390318 -1.19789109 -1.26923404
H 1.49572411 3.26664225 -0.24426407
H 1.19789109 2.39390318 1.26923404
H 1.49572411 -3.26664225 -0.24426407
H 1.19789109 -2.39390318 1.26923404
H -1.49572411 3.26664225 -0.24426407
H -1.19789109 2.39390318 1.26923404
H -1.49572411 -3.26664225 -0.24426407
H -1.19789109 -2.39390318 1.26923404
H -3.26664225 1.49572411 0.24426407
H -2.39390318 1.19789109 -1.26923404
H -3.26664225 -1.49572411 0.24426407
H -2.39390318 -1.19789109 -1.26923404
I also asked this question in researchgate but I can't find an answer:
Pages: 1
- Index
- » Search
- » Posts by Hans