Multiwfn forum
Multiwfn official website: http://sobereva.com/multiwfn. Multiwfn forum in Chinese: http://bbs.keinsci.com/wfn
You are not logged in.
- Topics: Active | Unanswered
#1 2021-08-01 18:07:37
- Hans
- Member
- Registered: 2018-10-24
- Posts: 10
Topological analysis of the electron density difference
I want to perform the topological analysis of the electron density difference (for example, of the water molecule). I previously placed the .wfn files in the Multiwfn directory as indicated in the manual, the steps I performed are as follows:
I execute the file water.fch in Multiwfn
iu //
-1 // I'm not sure here if I should use this option or the user-defined option "-3", then I continue:
5// data grid
-2// deformation property
1// electron density
3// high quality grid
0// return
2// topology analysis
-11// select function
100// user-defined function
6//
11// points in the sphere
6000//
-1// each nucleus in turn
-9// return
-10// return main menu
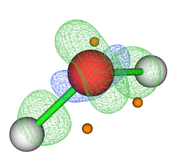
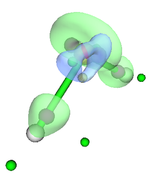
Then with the main option "13" I visualize the CPs and the isosurface (see Fig. 1). My question is whether this sequence of steps is correct for this type of analysis since the poincare-hopf relationship is not satisfied.
Offline
#2 2021-08-01 23:38:19

Re: Topological analysis of the electron density difference
Your steps are not correct, and as you can see from the resulting figure, the distribution of CPs are unlikely reasonable..
I strongly suggest you look at examples in Section 4.17.4 and 4.2.7 respectively to understand how to perform basin analysis for density difference, and how to refine the positions of the minima/maxima located via basin analysis module by topology analysis module.
If what you need is the exact positions of maxima and minima of deformation density rather than (3,-1) and (3,+1) CPs, the following steps are the best and robust:
There are three steps:
(1) Generate generate grid data of deformation density
Boot up Multiwfn and input path of H2O wavefunction file, then input
5 // Grid data calculation
-2 // Obtain deformation property
1 // Electron density
3 // High quality grid
0 // Return to main menu
(2) Perform basin analysis to locate maxima and minima
17 // Basin analysis modlue
1 // Generate basins
2 // Use grid data in memory
-4 // Export
3 // Export position of located maxima and minima to attractors.txt in current folder
-10 // Return to main menu
(3) Topology analysis on deformation density
iu // Change user-defined function
-3 // The user-defined function will correspond to interpolation function via B-spline algorithm, as mentioned in Section 2.7 of manual
2 // Topology analysis
-11 // Change the function to be analyzed
100 // User-defined function
1 // Search CPs from given starting points
4 // Using starting points from a .txt file
attractors.txt
0 // Return
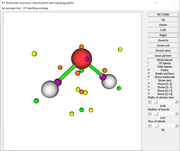
Now you can examine current CPs after entering option 0, purple and green spheres correspond to minima and maxima.
Then if you want to compare the CP positions with isosurfaces to confirm if the positions are indeed correct, you can then input
-10 // Return to main menu
13 // Process grid data
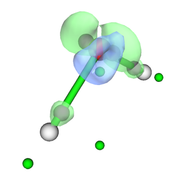
-2 // Examine isosurface
After properly adjust isovalue, to e.g. 0.09, as shown below, you can clearly see that green and blue isosurfaces enclose purple and green spheres respectively, so the minima and maxima of deformation density are indeed successfully located.
If you also need (3,-1) and (3,+1) CPs, after locating minima and maxima in topology analysis module, you can input
6 // Search CPs from a batch of points within a sphere
-1 // Start the search using each nucleus as sphere center in turn (I suggest choose this option several times until no new CPs can be found)
-9 // Return
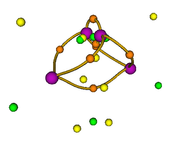
The current CPs shown in option 0:
As you can see, basically all CPs have been found. Satisfaction of poincare-hopf relationship is never important for complicated function like deformation density, you just need to focus on the CPs that you are really interested in.
In fact, it is not impossible to locate minima and maxima without making use of the basin analysis module and then refining their positions, however if you directly perform topology analysis for deformation density via option 6 in topology analysis module, positions of some minima and maxima can hardly be located due to numerical reason and the complexity of this function.
Offline
#3 2021-08-02 01:57:08
- Hans
- Member
- Registered: 2018-10-24
- Posts: 10
Re: Topological analysis of the electron density difference
it's correct thanks
Last edited by Hans (2021-08-02 02:02:01)
Offline