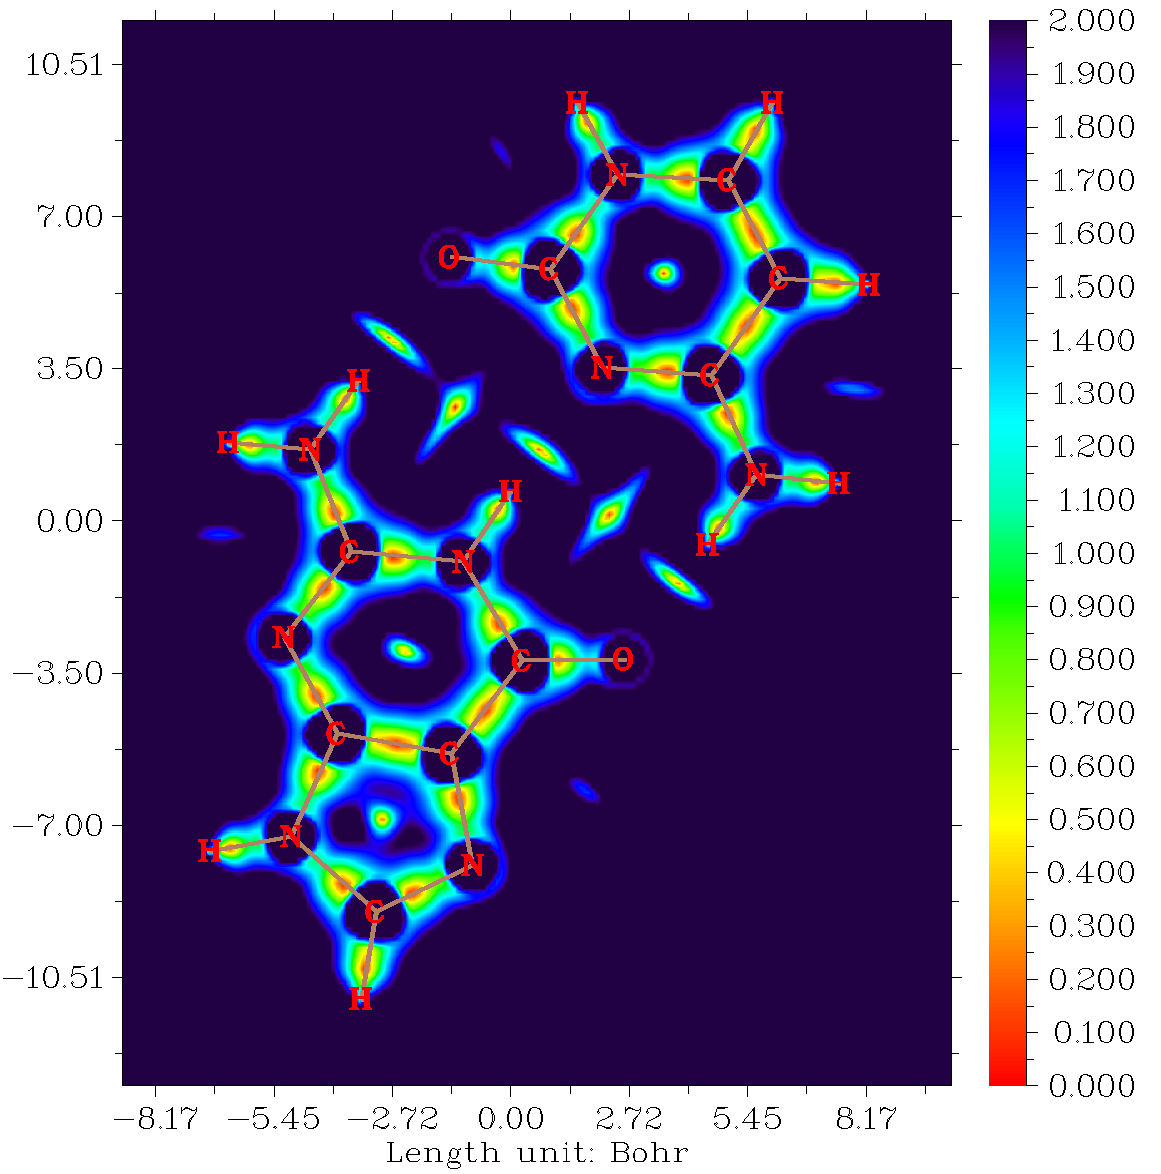
3. Plotting color-filled map of IRI on system plane of guanine-cytosine dimer
Boot up Multiwfn and input
GC.wfn
4 // Plot plane map
24 // IRI
1 // Color-filled map
[Press ENTER button directly to use default grid setting]
0 // Set extension distance around boundary atoms
2 // 2 Bohr is proper for present case
1 // XY plane
0 // Z=0. The current plotting plane is exactly identical to the system plane
Click right-mouse button on the graph to close it, then input:
8 // Enable showing bonds
14 // Brown
19 // Set color transition
2 // Reversed rainbow
4 // Enable showing atom labels
1 // Red
1 // Set lower&upper limit of color scale
0,2
-1 // Plot again
Now you can see the following map. You can also use other options to further improve the map.