2. Plotting isosurface map of IRI for phenol dimer
Boot up Multiwfn and input:
phenol_dimer.wfn
20 // Visual study of weak interaction
4 // Interaction region indicator (IRI) analysis
3 // High quality grid, about 1728000 points will be calculated (Note that if your system is much larger, in order to guarantee satisfactory quality of IRI isosurface, it is highly suggested to select mode 4 in this stage and then manually input grid spacing. Usually grid spacing of 0.1 ~ 0.15 Bohr is fine enough)
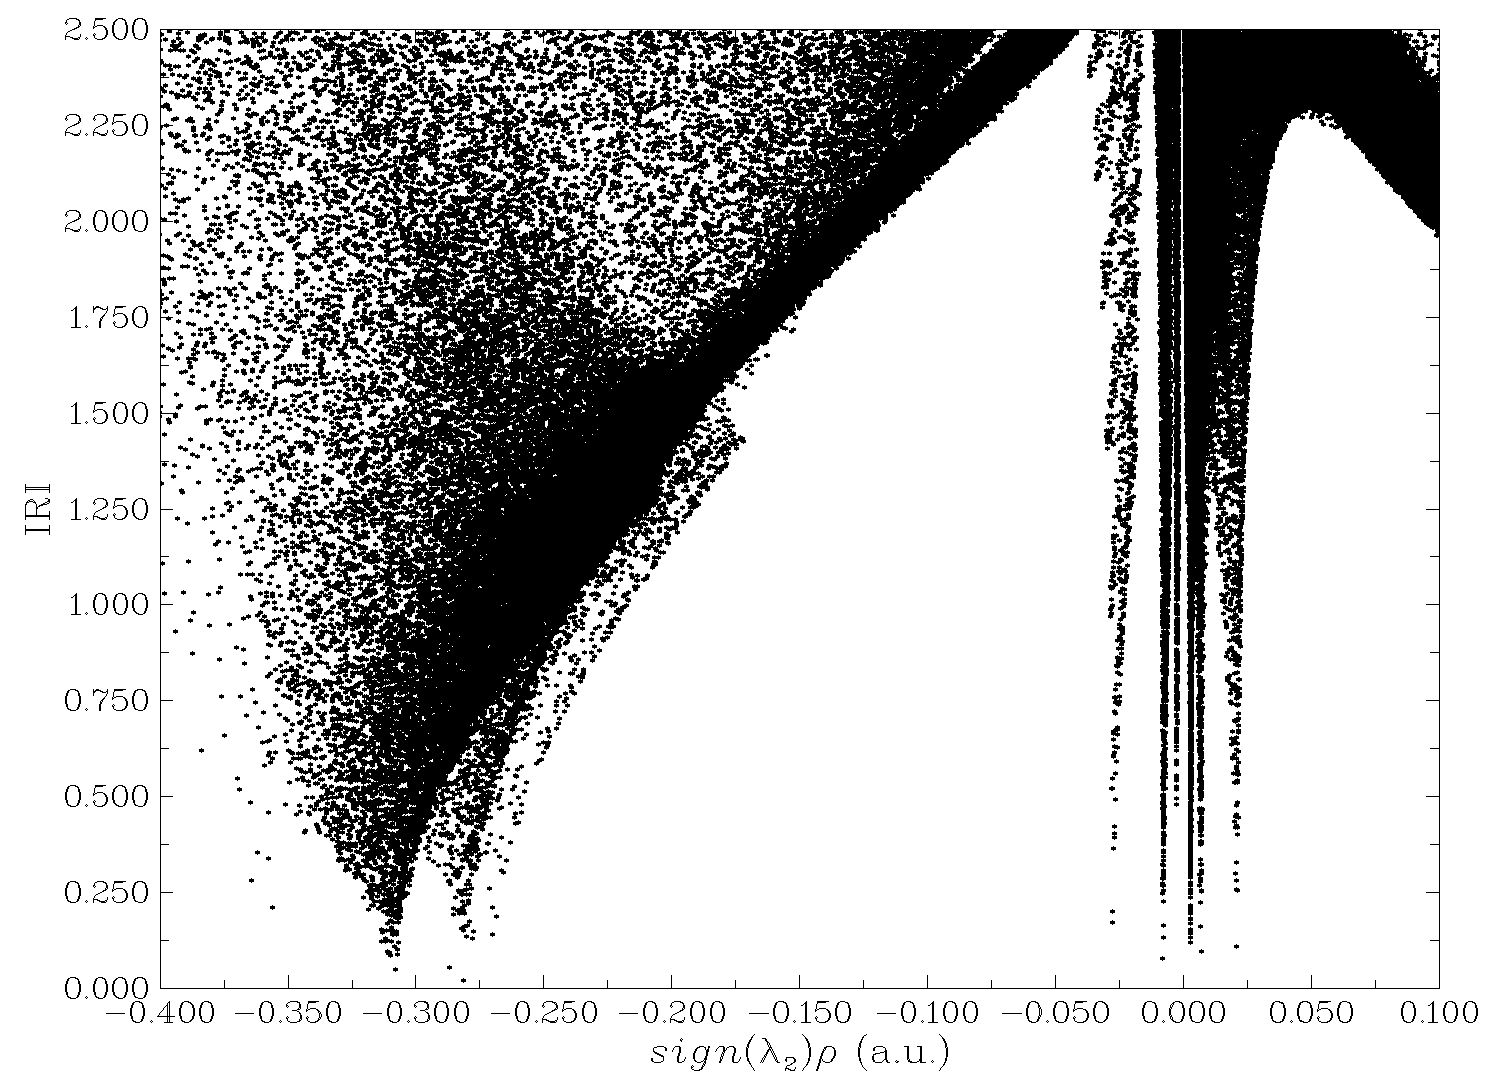
Once calculation is finished, you can select option "-1 Draw scatter graph" to visualize scatter map between IRI and \(\text{sign}(\lambda_2)\rho\), as shown below. You can also select other options to export the data as plain text file and then use third-part software such as gnuplot and Origin to plot it.
Using corresponding option in post-process menu, you can directly visualize IRI isosurfaces in Multiwfn. However, we will plot \(\text{sign}(\lambda_2)\rho\) colored IRI isosurface maps, this aim needs VMD program. Therefore, we select option "3 Output cube files to func1.cub and func2.cub in current folder", you will have "func1.cub" and "func2.cub" in current folder. Move the two files as well as the VMD plotting script "IRIfill.vmd" in "examples" folder of Multiwfn binary package to VMD installation folder, then boot up VMD and input source IRIfill.vmd in VMD console window to execute the script, you will see the following map in VMD, which is what we want.
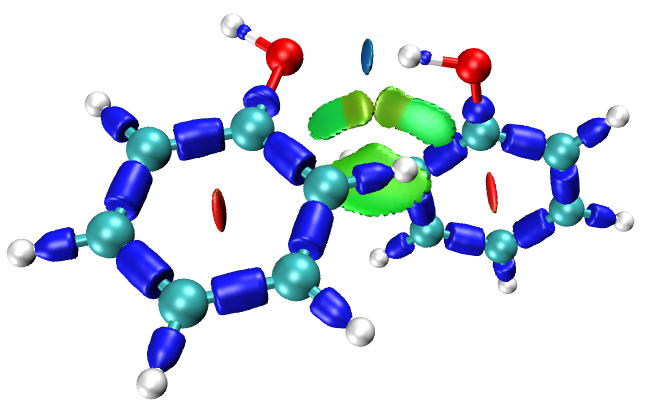
Note that the illustration of coloring method has been provided as examples\IRI_colorbar.png, you can include in your publications.
If you want to generate animation for showing variation of bonding in the whole process of chemical reaction based on IRC path, please check Section 4.A.1 of Multiwfn manual, you will get a lot of hints.