Multiwfn forum
Multiwfn official website: http://sobereva.com/multiwfn. Multiwfn forum in Chinese: http://bbs.keinsci.com/wfn
You are not logged in.
- Topics: Active | Unanswered
#1 2020-10-31 16:43:51

Plotting fluorescence spectrum by Multiwfn
Today a people asked me how to plot fluorescence spectra on ResearchGate, I copy my reply here since it may be useful for some Multiwfn users:
Here I assume that ground state of your system is singlet, the Kasha's rule is satisifed, and vibronic effect is ignored.
First, optimize your system using Gaussian keywords like # PBE1PBE/6-311G* opt TD. This task will simultaneously calculate three excited states but only optimize the geometry for the first excited state (S1 state). Then, boot up Multiwfn (http://sobereva.com/multiwfn) and load the TDDFT output file, then input the following commands:
11 // Plotting spectra
3 // UV-Vis
20 // Modify oscillator strengths
2-3 // Choose S2 and S3 states
0 // Set oscillator strengths to zero (because emission is from S1 state)
0 // Plot spectrumThe current graph shown on screen is just the fluorescence spectrum. You can then use various options in the present interface to change plotting setting to improve the plotting effect. See Section 4.11 of Multiwfn manual for examples and illustrations of spectrum plotting.
Offline
#2 2020-11-01 23:17:31
- Rania14
- Member
- Registered: 2020-11-01
- Posts: 7
Re: Plotting fluorescence spectrum by Multiwfn
Thank you for the clarity, but this spectrum it's only the Absorbance spectrum, not the fluorescence. Because normally for fluorescence, first we should choose an excitation wavelength.
Thank you, if I'm wrong, please correct me, it will be very helpful for me.
Offline
#3 2020-11-02 03:20:05
Re: Plotting fluorescence spectrum by Multiwfn
From computational aspect, you do not need to choose an excitation wavelength. According to Kasha's rule, no matter which excited state was excited to by the excitation light source, due to internal conversion, the fluorescence will finally corresponds to the emission from S1 state.
Although there is an experimental technique named fluorescence excitation spectrum, which detects the fluorescence intensity at specific wavelength by scanning wavelength of incident light, it is not directly related to the present topic.
Offline
#4 2020-11-02 11:50:19
- Rania14
- Member
- Registered: 2020-11-01
- Posts: 7
Re: Plotting fluorescence spectrum by Multiwfn
Thank you, it's so clear for me now.
I'm using Multiwfn to read my results of Gaussian 09, and I have some problem in Enery Gap, from TDOS spectrum I have 3.4eV and from experiment 2.9eV.
So there is a difference between values. I'm wondering if there is a problem in the model chossen (or in an another way which model should I choose to change the value of Eg and be near to experiment).
I'm using # td b3lyp/6-311++g(d,p).
Offline
#5 2020-11-03 12:43:33
Re: Plotting fluorescence spectrum by Multiwfn
Thank you, it's so clear for me now.
I'm using Multiwfn to read my results of Gaussian 09, and I have some problem in Enery Gap, from TDOS spectrum I have 3.4eV and from experiment 2.9eV.
So there is a difference between values. I'm wondering if there is a problem in the model chossen (or in an another way which model should I choose to change the value of Eg and be near to experiment).
I'm using # td b3lyp/6-311++g(d,p).
Please note that there are three kinds of well-known gaps, namely HOMO-LUMO gap, optical gap and fundamental gap, they must be distinguished since the values are very different, see Mater. Horiz., 1, 17 (2014) for introduction. For a molecule system, HOMO-LUMO gap is not a physically observed quantity, in other words, it cannot be experimentally determined at all. The HOMO-LUMO gap can be directly obtained based on HOMO and LUMO energies, it is reported in console window of Multiwfn after you entering main function 0 if .fch file is used as input, neither TDDFT calculation nor plotting TDOS is needed.
Before trying to compare calculation result with experimental value, please first make clear which kind of gap is the one you are really interested in.
PS: I wrote a very detailed article discussing the concept of HOMO, LUMO and gap, see http://sobereva.com/543, however it was written in Chinese, you may use Google translator to understand the basic content.
Offline
#6 2020-12-31 19:03:05
- permanenputro
- Member
- Registered: 2020-12-31
- Posts: 18
Re: Plotting fluorescence spectrum by Multiwfn
I have tried plotting absorption spectra and fluorescence spectra based on what Prof. Tian Lu. Surprised, when I found the plot results and the XY file on the absorption and fluorescence spectra, they were the same and not different. please, point out my mistakes and give me step-by-step instructions or guides for plotting fluorescence spectra.
thank you, it will be very helpful for me.
Figure 1 absorption spectra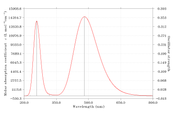
Figure 2 fluorescence spectra
Offline
#7 2021-01-01 06:21:31
Re: Plotting fluorescence spectrum by Multiwfn
There are two very different points between plotting absorption and fluorescence spectra
(1) To plot absorption spectrum, you should do excited state calculation at optimized ground state geometry. To plot fluorescence spectrum, you should do excited state calculation at optimized S1 state geometry (assume that Kasha's rule is valid for present system)
(2) To plot fluorescence spectrum, in Multiwfn, you should set oscillator strengths of all excited states other than S1 to zero, because only the S1 is emission state.
Offline
#8 2021-01-01 16:32:32
- permanenputro
- Member
- Registered: 2020-12-31
- Posts: 18
Re: Plotting fluorescence spectrum by Multiwfn
Dear Prof. Tian Lu
I have done it again as suggested by Prof. Tian Lu. However, the fluorescence spectrum results are still the same as the absorption spectrum. Thank you, if I'm wrong, please correct me, it will be very helpful for me.
step-by-step I did visualize the fluorescence spectrum as follows
#1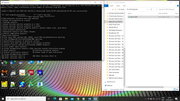
#2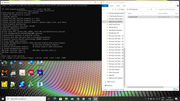
#3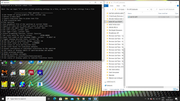
#4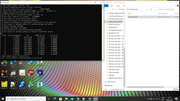
#5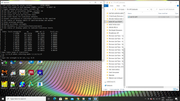
#6
#7
Offline
#9 2021-01-02 03:22:13
Offline
#10 2021-01-03 16:52:33
- permanenputro
- Member
- Registered: 2020-12-31
- Posts: 18
Re: Plotting fluorescence spectrum by Multiwfn
Hello Prof. Tian Lu
I have found plots of UV-vis and fluorescence spectra using Multiwfn. However, when I observe it, does this approach always show the same fluorescence spectra as the UV-vis spectra in the first excitation states?
Please, give me some publications that have used the Kasha rules approach (using Multiwfn software) to simulate fluorescence with the same plotting spectra that I found?
Thanks, advanced
Figure UV-Vis spectra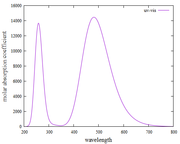
Figure Fluorescence spectra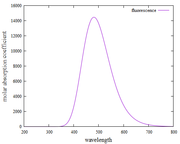
Figure UV-Vis and Fluorescence spectra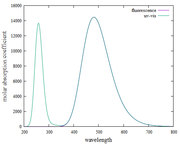
Offline
#11 2021-01-03 17:37:36
- permanenputro
- Member
- Registered: 2020-12-31
- Posts: 18
Re: Plotting fluorescence spectrum by Multiwfn
Are my findings for UV-Vis and fluorescence spectra (using the Kasha rules) correct?
Other than that,
Why is the Y-axis in the fluorescence spectrum the molar absorption coefficient? not absorbance
How can I find the pathlength and concentration values to convert the molar absorption coefficient to absorbance? my goal is to make the absorption spectrum [wavelength (nm) versus absorbance (a.u)]
Many thanks, Prof. Tian Lu
Offline
#12 2021-01-04 12:18:43
Re: Plotting fluorescence spectrum by Multiwfn
As I noted previously, a key reason that fluorescence spectrum is different to the UV-vis spectra is that TDDFT task for plotting fluorescence spectrum purpose should be carried out at optimized S1 geometry. It is evident that optimized S0 geometry must be different to S1 geometry, this is why there is so-called Stoke shift phenomenon.
To compare with experimental fluorescence spectrum, you do not need to pay attention to specific unit of Y-axis of simulated fluorescence spectrum, you can arbitrarily scale the Y-axis data to make simulated spectrum best match the experimental one for easier comparison.
Offline
#13 2021-01-13 16:51:24
- rikaaardoss
- Member
- Registered: 2020-07-29
- Posts: 22
Re: Plotting fluorescence spectrum by Multiwfn
Dear Professor Tian Lu, the question I will ask is mostly technical. If when optimizing to the T1 state, the geometry changes with respect to S0 (Assuming that S0 is the fundamental state), the difference of energies obtained through the TDDFT calculation S0 - T1 (Using the geometry in the T1 state), would be different than the one obtained with the delta scf method since it would be approximately :
(1) Eem1 = ET1 - ES0 ---> delta scf method
(2) Eem2 = ET1 - ES0' --> TDDFT ( I added ' since the S0 using the T1 geometry would not be equal to the optimized S0)
So, which one would be the most appropriate? It seems to me that (1), as long as the S0 and T1 geometries were notably different
Thank you in advance for your response and feedback on this issue.
R.
Offline
#14 2021-01-14 23:12:37
Re: Plotting fluorescence spectrum by Multiwfn
Dear R.,
If you purpose is simply calculating S0-T1 energy separation at T1 geometry, I suggest using delta-SCF (i.e. UKS) method to optimize the T1 geometry and calculate the energies of the S0 and T1 states at the optimized T1 geometry. This is because UKS is much cheaper than TDDFT since it is a single-determinant method, and UKS calculation fully takes into account the orbital relaxation effect, so theoretically the result should be better.
However, if you need to compare T1 energy with e.g. S1 energy at the T1 geometry, I suggest optimizing T1 using UKS, and then calculate both S1 and T1 energies using TDDFT. This is because usually S1 can only be calculated using TDDFT (rather than UKS), and only S1 and T1 energies calculated via the same method is comparable.
Optimizing T1 using TDDFT is highly deprecated, because TDDFT optimization is significantly more expensive than UKS, and the result is worse because of neglect of orbital relaxation.
Offline
#15 2021-01-15 01:27:31
- rikaaardoss
- Member
- Registered: 2020-07-29
- Posts: 22
Re: Plotting fluorescence spectrum by Multiwfn
Dear Tian Lu, thank you very much for your kind reply, I understand that to study the T1 status it is better to use UKS, however I wonder what would happen if I had a system that did not comply with the Kasha rule? (Anti-kasha compounds). For example, azulene is a system that does not comply with this rule although it is related to fluorescence (singlet excited states). I am interested in studying phosphorescent systems that do not comply with the Kasha rule, it would be recommended to study these systems using TDDFT? Especially because many compounds can be too "big" to be studied with multiconfiguration tools. I have reviewed literature, however in the computational details of certain articles is sometimes not very clear how they made the optimizations using TDDFT in triplet state, it seems that there are many "tricks".
Thanks again for your answer
R.
Offline
#16 2021-01-15 07:53:42
Re: Plotting fluorescence spectrum by Multiwfn
Since azulene has fluorescence emission from S2, you have to use TDDFT to optimize S2, there is no cheaper way for this purpose. (although CIS is even cheaper, its accuracy is really too poor to accept)
Offline