Multiwfn forum
Multiwfn official website: http://sobereva.com/multiwfn. Multiwfn forum in Chinese: http://bbs.keinsci.com/wfn
You are not logged in.
- Topics: Active | Unanswered
#1 2019-10-16 03:35:56
- shenaya
- Member
- Registered: 2019-10-16
- Posts: 34
Electron density and Laplacian of electron density
Dear All,
I'm a new user and trying to perform an electron density and Laplacian electron density analysis of a Ru complex.
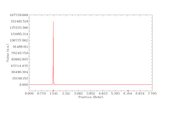
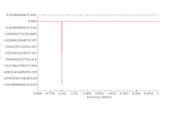
I have used gaussian fchk files as input and got very high unusual electron density values.
maximum electron density 152481 a.u
maximum laplacian electron density -5102806856254
I have used these keywords in Gaussian to generate input files. output=wfn density=current
Can you please explain what might I have done wrong.
Thank you
Shen
Last edited by shenaya (2019-10-16 05:09:30)
Offline
#2 2019-10-16 05:10:08
- shenaya
- Member
- Registered: 2019-10-16
- Posts: 34
Offline
#3 2019-10-16 16:01:29
Re: Electron density and Laplacian of electron density
This observation is not necessarily wrong. For very heavy atom, the value of Laplacian of electron density around nuclei is often extremely large, therefore the automatically determined Y-axis range is quite broad. If you want to study Laplacian of electron density in bonding region, you should set range of Y-axis to a proper value, for example, from -200 to 200.
Offline
#4 2019-10-17 01:41:16
- shenaya
- Member
- Registered: 2019-10-16
- Posts: 34
Re: Electron density and Laplacian of electron density
Thank you very much for your reply.
Can suggest me some examples or tutorials to follow.
Regards,
Shen
Offline
#5 2019-10-17 13:06:43
Re: Electron density and Laplacian of electron density
Section 4.3 of Multiwfn manual provides some examples for plotting curve maps. I will reply you if you have any specific questions.
Note that commonly, Laplacian of electron density is studied in terms of plane map (usually contour line map) or isosurface map, rather than curve map. The steps of plotting representative plane maps are illustrated in Section 4.4 of Multiwfn manual.
Offline

