Multiwfn forum
Multiwfn official website: http://sobereva.com/multiwfn. Multiwfn forum in Chinese: http://bbs.keinsci.com/wfn
You are not logged in.
- Topics: Active | Unanswered
#1 2026-01-15 16:22:32
- hisacro
- Member
- Registered: 2026-01-15
- Posts: 2
Confusion between isosurface values and LUMO+x levels
Hello,
I'm trying to contour plot the projections of the orbitals LUMO to LUMO+10. I looked up the manual section 3.5, especially the contour line maps. In this plot there is only option for contour values, I believe this is isosurface values but how this translates to LUMO levels?. I also get a message on the console when plotting, 'LUMO+9 levels' are omitted to save memory.
I think I'm missing something really fundamental inregards to understanding. In the end I want to plot the projections of 10 levels starting from LUMO but I couldn't find the options.
Thanks.
I'm running version 3.8 Multiwfn
Last edited by hisacro (2026-01-15 16:23:50)
Offline
#2 2026-01-15 21:11:03

Re: Confusion between isosurface values and LUMO+x levels
Section 3.5 describes plotting plane map (realized by main function 4 of Multiwfn), including contour line map. LUMO (or other orbitals) wavefunction is a 3D real space function, in order to plot it as a contour line map, you need to specify one or more contour values (Note that "isosurface value" or "isovalue" is only involved in 3D isosurface map, which can be plotted by main function 5).
Hope this clarifies enough.
Offline
#3 2026-01-16 07:59:02
- hisacro
- Member
- Registered: 2026-01-15
- Posts: 2
Re: Confusion between isosurface values and LUMO+x levels
Thanks sobereva, that cleared up the isosurface confusion.
I played around with the functions in 4, I have following findings
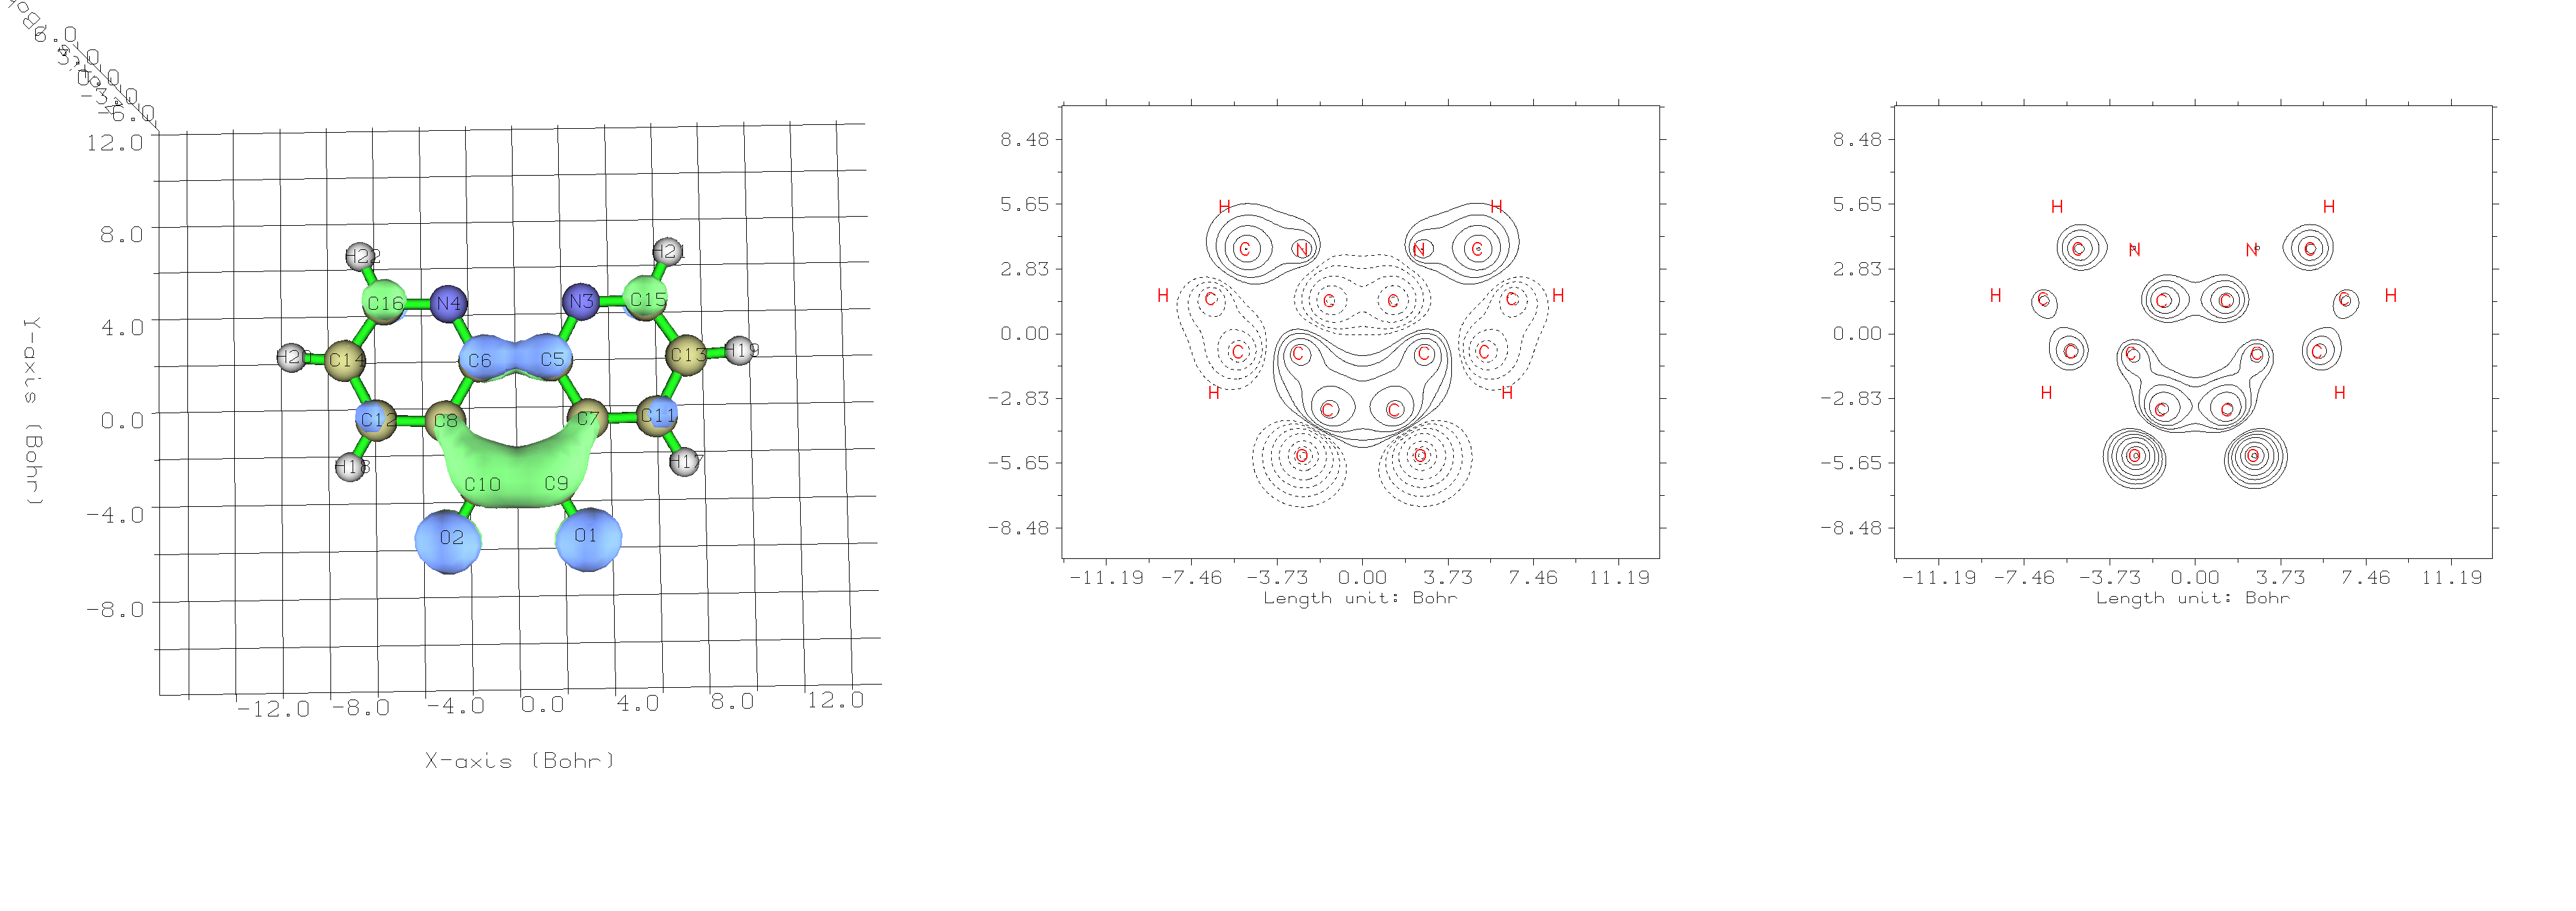
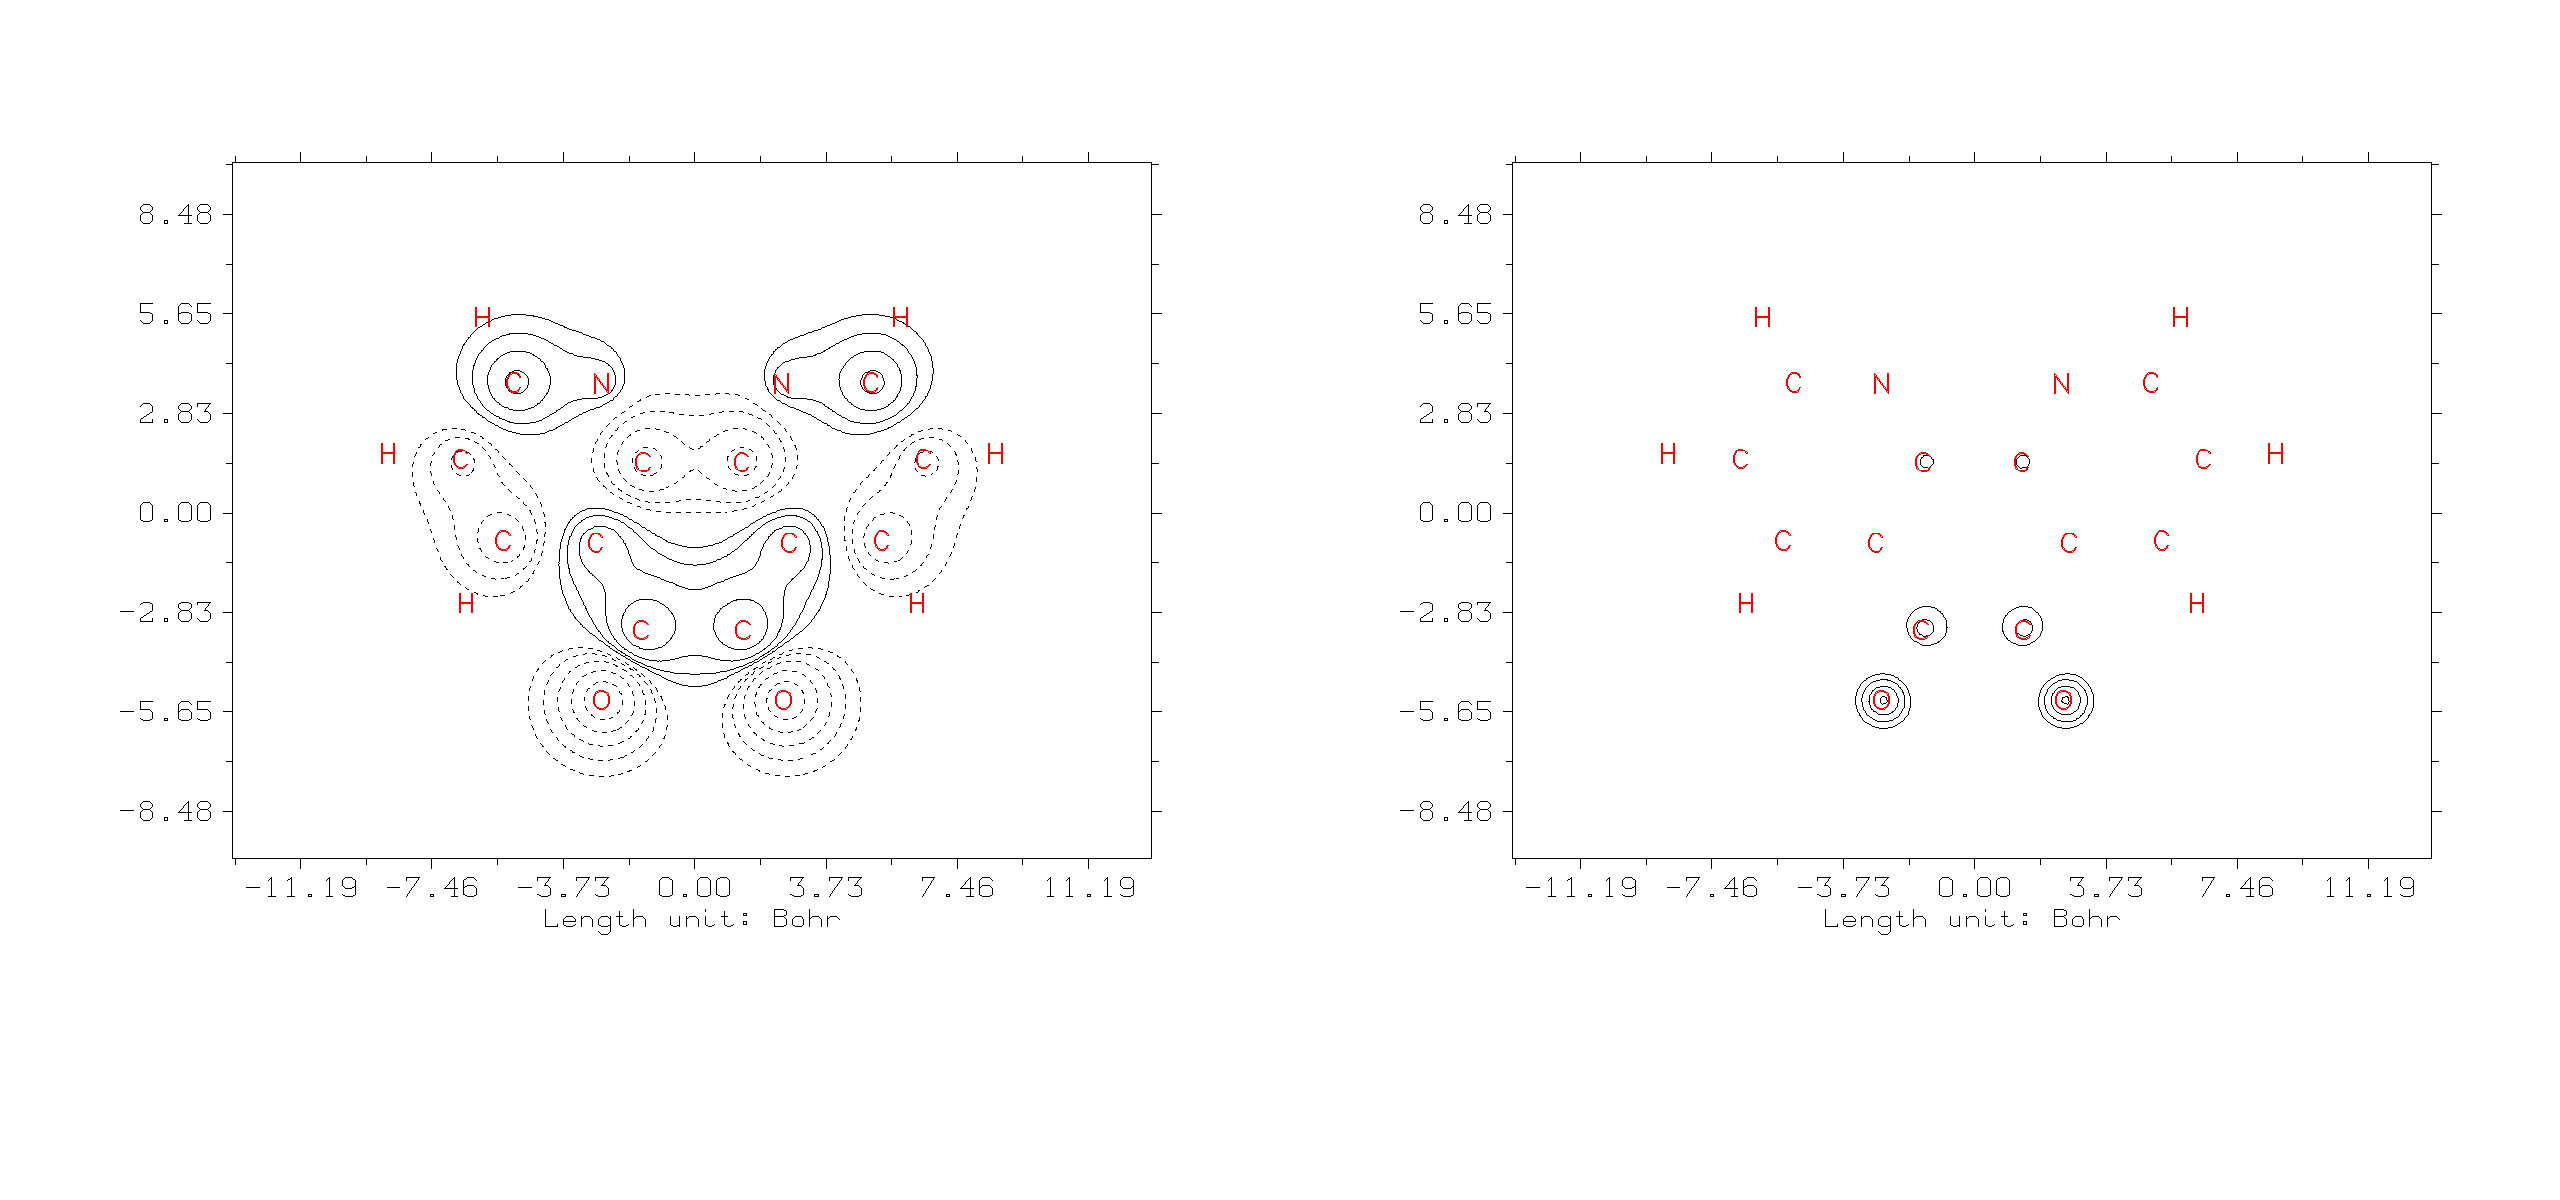
First image is the LUMO plot from function 0, second is from 4 -> 4 (Value of Orbital wave-function) and last one is 4 -> 44 (Orbital probability density).
As you can see, the probability density plot is the one that matches the contour projections. (both are plotted in xy-plane with Z=0.5bohr). I have also tested the "Special in-built function" in the plotting menu, ie.
# 3 Change setting of contour lines
# 5 Use built-in contour
# 3 For plotting orbital wavefunction
It seems to me, it just changed the value of Z. Is this the intended use case?
Thanks,
For clarification, I'm running these Multiwfn 3.8 on *Linux machine.
Offline
#4 2026-01-20 05:55:42
Re: Confusion between isosurface values and LUMO+x levels
The 3D isosurface map you illustrated corresponds to orbital wavefunction, green and blue parts correspond to positive and negative phases, respectively. The contour line map of "4 -> 4 (Value of Orbital wave-function)" directly corresponds to the 2D-map on the slice plane of this isosurface map."Orbital probability density" is square of "Value of Orbital wave-function" (according to the well-known Born's probability interpretation of wave function).
The option "5 Use built-in contour values suitable for special purpose" is designed for quickly setting contour values for plotting specific kind of real space function. You can use it for convenience but it is never always needed.
Offline