Multiwfn forum
Multiwfn official website: http://sobereva.com/multiwfn. Multiwfn forum in Chinese: http://bbs.keinsci.com/wfn
You are not logged in.
- Topics: Active | Unanswered
Pages: 1
#1 2021-03-08 18:16:28
- Quark
- Member
- Registered: 2020-06-24
- Posts: 15
Plotting a Charge Displacement Curve
Dear Professor Tian Lu,
In my study, there is a need to analyze changes in charge transfer. I would like to use the Charge Displacement function (CD), which allows you to analyze and visualize changes in charge transfer. However, I cannot figure out how to plot the CD.
As indicated in the article, it is necessary to construct an electron density difference map and integrate it along the z-axis.
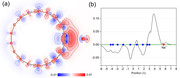
"To make the picture of the bonding which emerges from the density difference plots more quantitative, we show, below each one, the curve representing the partial integral of the density difference along the internuclear axis. This thus measures the actual electronic charge fluctuation with respect to the isolated fragments, as one moves from left to right along the internuclear axis (z) and is defined as follows:
where Δq, is the electron density of the complex minus that of the two isolated fragments. The red dots on the curves in Figures mark the nuclear positions, while the dashed vertical line marks the fragment boundary defined earlier. DOI:10.1021/ja0772647, 10.3390/molecules25020300"
Tell me, please, how do I integrate the electronic density difference map with Multiwfn?
I managed to construct a 1D map of the electronic density difference as specified in detail in the manual to Multiwfn. But I can't figure out how to integrate?
I really hope that such a useful function will appear in the future in the Multiwfn program.
Thank you in advance for your answers.
--
Best regards
Eugene
Last edited by Quark (2021-03-08 19:01:30)
Offline
#2 2021-03-08 22:47:31

Re: Plotting a Charge Displacement Curve
Dear Eugene,
The Charge Displacement Curve can be easily plotted via main function 13, see Section 4.13.6 of Multiwfn manual, relevant introduction is given in Section 3.16.14.
The 2D map of electron density difference can be plotted via main function 4, see Section 4.4.8 for example.
BTW: The following map presented in SI of Carbon 171 (2021) 514-523 (https://doi.org/10.1016/j.carbon.2020.09.048), which is my recent publication, was generated by Multiwfn
Best regards,
Tian
Offline
#3 2021-03-10 00:50:09
- Quark
- Member
- Registered: 2020-06-24
- Posts: 15
Re: Plotting a Charge Displacement Curve
Dear Professor Tian Lu,
Thanks a lot for your help.
I was able to successfully plot the graph for the test molecule I3 but ran into a problem when plotting the CD for he molecule under investigation.
Unfortunately, I cannot understand on which axis I need to integrate, what to study the charge transfer of the M-M-donor contact?
To calculate the CD plot, it is required to integrate along the Z-axis. In the calculation, the Orca program orientates the molecule in an arbitrary direction (Fig. a). Please tell me if it is possible to reorient the molecule so that the analyzed contacts M-M-donor were located on the Z-axis (Fig. b) for calculating the CD plot.
How to get coordinates of atoms for CD curve?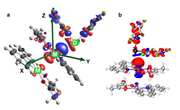
Best regards
Eugene
P.s.:
Thank you for pointing to your new interesting work. I will certainly quote this article in work on the study of non-covalent interactions.
Offline
#4 2021-03-10 01:15:34
Re: Plotting a Charge Displacement Curve
You can use e.g. GaussView to properly rotate your system so that Z-axis is parallel to the direction for plotting CD map. Unlike Gaussian, ORCA doesn't automatically reorientate the system to standard orientation. Namely the coordinate in the generated .molden file is always identical to the input file.
Offline
#5 2024-10-17 12:41:08
- s0fk1
- Member
- Registered: 2024-10-17
- Posts: 5
Re: Plotting a Charge Displacement Curve
Hello to everyone!May I ask how the isodensity boundary of the two fragments, defining a plane that separates them is calculated? I have read several papers mentioning it but I cannot understand how to calculate it with accuracy.
Offline
#6 2024-10-18 00:14:52
Re: Plotting a Charge Displacement Curve
Hello to everyone!May I ask how the isodensity boundary of the two fragments, defining a plane that separates them is calculated? I have read several papers mentioning it but I cannot understand how to calculate it with accuracy.
Perhaps you mean Becke surface or Hirshfeld surface. Please check examples in Sections 4.12.5 and 4.12.6 of Multiwfn manual, also check Fig. 17 in the new Multiwfn introduction paper J. Chem. Phys., 161, 082503 (2024); DOI: 10.1063/5.0216272
Offline
#7 2024-10-18 09:12:25
- s0fk1
- Member
- Registered: 2024-10-17
- Posts: 5
Re: Plotting a Charge Displacement Curve
Dear Tian,
Thank you so much for your prompt response. I was referring to the isodensity surface as it is introduced in various papers plotting the CDF. For example, in https://pubs.acs.org/doi/10.1021/ja0772647, the refer to: "The dashed contour marks the isodensity value of both isolated fragments which crosses the internuclear axis at the same point and may thus serve to visualize tangent boundaries enclosing the non-interacting fragments." which is the dashed vertical line in the Figure posted above by Quark. In another paper https://pubs.acs.org/doi/10.1021/acs.organomet.6b00346 they refer to: "To have a numerical estimate of the CT, one can refer to the value of the CD curve at some specific point between the fragments: namely, define a plane separating them. This is of course arbitrary, but as a reasonable model, which has already been used, is to take CT at the so-called isodensity boundary: i.e., the point along z′ where the electron densities of the noninteracting fragments become equal."
Based on this description, I tried to calculate the electron denisty of each fragment, plot them along the z-axis and se where they coincide. However, I couldn't find the way to do that with MultiWfn.
I so much appreciate your help!
Offline
#8 2024-10-18 10:50:05
Re: Plotting a Charge Displacement Curve
Please check Section 4.13.6 of Multiwfn manual, there is an example of plotting charge displacement curve.
If you need to obtain "the point along z′ where the electron densities of the noninteracting fragments become equal.", you can use wavefunction file of fragment 1 to ask Multiwfn to plot plane-averaged curve of electron density of fragment 1, and then repeat the steps for fragment 2, and finally manually find the z' position by plotting the two curves together in e.g. Origin.
Offline
#9 2024-10-18 15:00:35
- s0fk1
- Member
- Registered: 2024-10-17
- Posts: 5
Re: Plotting a Charge Displacement Curve
Dear Tian,
I did so by first calculating the electron density of each fragment, and then go to process grid data and plot average of xy planes for a range of z. However, I do not understand the output, I would expect a column with the z-axis values that I asked for (I asked from -8 to 8) and another column with the density value. However, I get three columns, where the middle one is repeated periodically. See for example how it goes from -7.84 to 6.89 two times already in the part of the file I copied.
-6.910751 -7.845053 0.000000000000000
-6.910751 -7.715778 0.000000000000000
-6.910751 -7.586504 0.000000000000000
-6.910751 -7.457229 0.000000000000000
-6.910751 -7.327954 0.000000000000000
-6.910751 -7.198679 0.000000000000000
-6.910751 -7.069404 0.000000000000000
-6.910751 -6.940129 0.000000000000000
-6.910751 -6.810854 0.000000000000000
-6.910751 -6.681579 0.000000000000000
-6.910751 -6.552305 0.000000000000000
-6.910751 -6.423030 0.000000000000000
-6.910751 -6.293755 0.000000000000000
-6.910751 -6.164480 0.000000000000000
-6.910751 -6.035205 0.000000000000000
-6.910751 -5.905930 0.000000000000000
-6.910751 -5.776655 0.000000000000001
-6.910751 -5.647380 0.000000000000001
-6.910751 -5.518106 0.000000000000003
-6.910751 -5.388831 0.000000000000008
-6.910751 -5.259556 0.000000000000017
-6.910751 -5.130281 0.000000000000037
-6.910751 -5.001006 0.000000000000080
-6.910751 -4.871731 0.000000000000165
-6.910751 -4.742456 0.000000000000331
-6.910751 -4.613181 0.000000000000644
-6.910751 -4.483907 0.000000000001221
-6.910751 -4.354632 0.000000000002247
-6.910751 -4.225357 0.000000000004016
-6.910751 -4.096082 0.000000000006975
-6.910751 -3.966807 0.000000000011770
-6.910751 -3.837532 0.000000000019296
-6.910751 -3.708257 0.000000000030739
-6.910751 -3.578982 0.000000000047586
-6.910751 -3.449708 0.000000000071598
-6.910751 -3.320433 0.000000000104721
-6.910751 -3.191158 0.000000000148930
-6.910751 -3.061883 0.000000000206011
-6.910751 -2.932608 0.000000000277302
-6.910751 -2.803333 0.000000000363437
-6.910751 -2.674058 0.000000000464174
-6.910751 -2.544783 0.000000000578366
-6.910751 -2.415509 0.000000000704178
-6.910751 -2.286234 0.000000000839586
-6.910751 -2.156959 0.000000000983208
-6.910751 -2.027684 0.000000001135427
-6.910751 -1.898409 0.000000001299733
-6.910751 -1.769134 0.000000001484143
-6.910751 -1.639859 0.000000001702512
-6.910751 -1.510584 0.000000001975478
-6.910751 -1.381310 0.000000002330745
-6.910751 -1.252035 0.000000002802383
-6.910751 -1.122760 0.000000003428805
-6.910751 -0.993485 0.000000004249190
-6.910751 -0.864210 0.000000005298274
-6.910751 -0.734935 0.000000006599759
-6.910751 -0.605660 0.000000008158995
-6.910751 -0.476385 0.000000009956025
-6.910751 -0.347111 0.000000011940449
-6.910751 -0.217836 0.000000014029641
-6.910751 -0.088561 0.000000016111622
-6.910751 0.040714 0.000000018053174
-6.910751 0.169989 0.000000019712808
-6.910751 0.299264 0.000000020957042
-6.910751 0.428539 0.000000021677502
-6.910751 0.557814 0.000000021805840
-6.910751 0.687088 0.000000021323660
-6.910751 0.816363 0.000000020265467
-6.910751 0.945638 0.000000018714023
-6.910751 1.074913 0.000000016788996
-6.910751 1.204188 0.000000014631095
-6.910751 1.333463 0.000000012384634
-6.910751 1.462738 0.000000010181523
-6.910751 1.592013 0.000000008129083
-6.910751 1.721287 0.000000006303056
-6.910751 1.850562 0.000000004745993
-6.910751 1.979837 0.000000003470230
-6.910751 2.109112 0.000000002463974
-6.910751 2.238387 0.000000001698846
-6.910751 2.367662 0.000000001137385
-6.910751 2.496937 0.000000000739424
-6.910751 2.626211 0.000000000466779
-6.910751 2.755486 0.000000000286128
-6.910751 2.884761 0.000000000170313
-6.910751 3.014036 0.000000000098441
-6.910751 3.143311 0.000000000055255
-6.910751 3.272586 0.000000000030119
-6.910751 3.401861 0.000000000015945
-6.910751 3.531136 0.000000000008200
-6.910751 3.660410 0.000000000004096
-6.910751 3.789685 0.000000000001989
-6.910751 3.918960 0.000000000000939
-6.910751 4.048235 0.000000000000431
-6.910751 4.177510 0.000000000000192
-6.910751 4.306785 0.000000000000084
-6.910751 4.436060 0.000000000000036
-6.910751 4.565335 0.000000000000015
-6.910751 4.694609 0.000000000000006
-6.910751 4.823884 0.000000000000002
-6.910751 4.953159 0.000000000000001
-6.910751 5.082434 0.000000000000000
-6.910751 5.211709 0.000000000000000
-6.910751 5.340984 0.000000000000000
-6.910751 5.470259 0.000000000000000
-6.910751 5.599534 0.000000000000000
-6.910751 5.728808 0.000000000000000
-6.910751 5.858083 0.000000000000000
-6.910751 5.987358 0.000000000000000
-6.910751 6.116633 0.000000000000000
-6.910751 6.245908 0.000000000000000
-6.910751 6.375183 0.000000000000000
-6.910751 6.504458 0.000000000000000
-6.910751 6.633733 0.000000000000000
-6.910751 6.763007 0.000000000000000
-6.910751 6.892282 0.000000000000000
-6.781476 -7.845053 0.000000000000000
-6.781476 -7.715778 0.000000000000000
-6.781476 -7.586504 0.000000000000000
-6.781476 -7.457229 0.000000000000000
-6.781476 -7.327954 0.000000000000000
-6.781476 -7.198679 0.000000000000000
-6.781476 -7.069404 0.000000000000000
-6.781476 -6.940129 0.000000000000000
-6.781476 -6.810854 0.000000000000000
-6.781476 -6.681579 0.000000000000000
-6.781476 -6.552305 0.000000000000000
-6.781476 -6.423030 0.000000000000000
-6.781476 -6.293755 0.000000000000000
-6.781476 -6.164480 0.000000000000000
-6.781476 -6.035205 0.000000000000000
-6.781476 -5.905930 0.000000000000000
-6.781476 -5.776655 0.000000000000001
-6.781476 -5.647380 0.000000000000003
-6.781476 -5.518106 0.000000000000007
-6.781476 -5.388831 0.000000000000017
-6.781476 -5.259556 0.000000000000039
-6.781476 -5.130281 0.000000000000084
-6.781476 -5.001006 0.000000000000180
-6.781476 -4.871731 0.000000000000371
-6.781476 -4.742456 0.000000000000746
-6.781476 -4.613181 0.000000000001454
-6.781476 -4.483907 0.000000000002756
-6.781476 -4.354632 0.000000000005072
-6.781476 -4.225357 0.000000000009070
-6.781476 -4.096082 0.000000000015757
-6.781476 -3.966807 0.000000000026595
-6.781476 -3.837532 0.000000000043612
-6.781476 -3.708257 0.000000000069490
-6.781476 -3.578982 0.000000000107599
-6.781476 -3.449708 0.000000000161923
-6.781476 -3.320433 0.000000000236864
-6.781476 -3.191158 0.000000000336884
-6.781476 -3.061883 0.000000000465997
-6.781476 -2.932608 0.000000000627176
-6.781476 -2.803333 0.000000000821756
-6.781476 -2.674058 0.000000001049012
-6.781476 -2.544783 0.000000001306062
-6.781476 -2.415509 0.000000001588306
-6.781476 -2.286234 0.000000001890496
-6.781476 -2.156959 0.000000002208534
-6.781476 -2.027684 0.000000002541897
-6.781476 -1.898409 0.000000002896546
-6.781476 -1.769134 0.000000003287978
-6.781476 -1.639859 0.000000003744023
-6.781476 -1.510584 0.000000004306842
-6.781476 -1.381310 0.000000005033516
-6.781476 -1.252035 0.000000005994546
-6.781476 -1.122760 0.000000007269626
-6.781476 -0.993485 0.000000008940179
-6.781476 -0.864210 0.000000011078564
-6.781476 -0.734935 0.000000013734445
-6.781476 -0.605660 0.000000016919683
-6.781476 -0.476385 0.000000020593987
-6.781476 -0.347111 0.000000024654307
-6.781476 -0.217836 0.000000028931141
-6.781476 -0.088561 0.000000033194403
-6.781476 0.040714 0.000000037170123
-6.781476 0.169989 0.000000040567155
-6.781476 0.299264 0.000000043110737
-6.781476 0.428539 0.000000044577773
-6.781476 0.557814 0.000000044827636
-6.781476 0.687088 0.000000043822654
-6.781476 0.816363 0.000000041634199
-6.781476 0.945638 0.000000038433058
-6.781476 1.074913 0.000000034465974
-6.781476 1.204188 0.000000030022857
-6.781476 1.333463 0.000000025400798
-6.781476 1.462738 0.000000020871060
-6.781476 1.592013 0.000000016654011
-6.781476 1.721287 0.000000012904812
-6.781476 1.850562 0.000000009710214
-6.781476 1.979837 0.000000007094791
-6.781476 2.109112 0.000000005033573
-6.781476 2.238387 0.000000003467640
-6.781476 2.367662 0.000000002319582
-6.781476 2.496937 0.000000001506619
-6.781476 2.626211 0.000000000950205
-6.781476 2.755486 0.000000000581912
-6.781476 2.884761 0.000000000346047
-6.781476 3.014036 0.000000000199832
-6.781476 3.143311 0.000000000112067
-6.781476 3.272586 0.000000000061039
-6.781476 3.401861 0.000000000032294
-6.781476 3.531136 0.000000000016599
-6.781476 3.660410 0.000000000008292
-6.781476 3.789685 0.000000000004026
-6.781476 3.918960 0.000000000001902
-6.781476 4.048235 0.000000000000874
-6.781476 4.177510 0.000000000000392
-6.781476 4.306785 0.000000000000171
-6.781476 4.436060 0.000000000000073
-6.781476 4.565335 0.000000000000031
-6.781476 4.694609 0.000000000000013
-6.781476 4.823884 0.000000000000005
-6.781476 4.953159 0.000000000000002
-6.781476 5.082434 0.000000000000001
-6.781476 5.211709 0.000000000000000
-6.781476 5.340984 0.000000000000000
-6.781476 5.470259 0.000000000000000
-6.781476 5.599534 0.000000000000000
-6.781476 5.728808 0.000000000000000
-6.781476 5.858083 0.000000000000000
-6.781476 5.987358 0.000000000000000
-6.781476 6.116633 0.000000000000000
-6.781476 6.245908 0.000000000000000
-6.781476 6.375183 0.000000000000000
-6.781476 6.504458 0.000000000000000
-6.781476 6.633733 0.000000000000000
-6.781476 6.763007 0.000000000000000
-6.781476 6.892282 0.000000000000000
(.........)
Offline
#11 2024-10-19 15:01:31
- s0fk1
- Member
- Registered: 2024-10-17
- Posts: 5
Re: Plotting a Charge Displacement Curve
Dear Tian, maybe I am missing something important here but I asked for:
5 Output average data of XY planes in a range of Z to output.txt
I inputed to span z from -8 to 8
and the prompt on the screen says:
There are 125 layers within the range
Column 1,2,3 correspond to X,Y,value respectively
So how would I know to what Z each X,Y pair with its corresponding electron density value correspond to, so I can plot the elecytron density vs the z-axis?
Offline
#12 2024-10-20 01:30:47
Re: Plotting a Charge Displacement Curve
Dear Tian, maybe I am missing something important here but I asked for:
5 Output average data of XY planes in a range of Z to output.txt
I inputed to span z from -8 to 8
and the prompt on the screen says:
There are 125 layers within the range
Column 1,2,3 correspond to X,Y,value respectivelySo how would I know to what Z each X,Y pair with its corresponding electron density value correspond to, so I can plot the elecytron density vs the z-axis?
This option is not what you need in the present context. You should use "18 Plot (local) integral curve or plane-averaged in X/Y/Z direction"
Offline
#13 2024-10-20 17:56:01
- s0fk1
- Member
- Registered: 2024-10-17
- Posts: 5
Re: Plotting a Charge Displacement Curve
I see now! Thank you very much!
Offline
Pages: 1