Multiwfn forum
Multiwfn official website: http://sobereva.com/multiwfn. Multiwfn forum in Chinese: http://bbs.keinsci.com/wfn
You are not logged in.
- Topics: Active | Unanswered
Pages: 1
#1 2020-10-20 21:35:36
- icamps
- Member
- Registered: 2018-05-17
- Posts: 33
<< Graphs scale >>
Hello,
I am doing topological study using one script. In this script, I generate several graphs for different properties.
My problem is that the first graph has an scale different from the other ones.
I analyzed my scrip but didn't find where is the problem.
Here are the script and two graphs.
Regards,
Camps
Offline
#2 2020-10-20 22:20:22
Offline
#3 2020-10-21 11:52:01
- icamps
- Member
- Registered: 2018-05-17
- Posts: 33
Re: << Graphs scale >>
Thanks for your replay.
I followed your recommendation but the behavior continues.
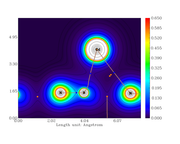
Both graphs have different size scales. The first one (just the gradient lines) both X and Y axis have the same size (extend to the same maximum value), so, this graph is square. In case of the color-filled map, the Y axis is different (lower max value) than the X axis, so, this graph is rectangular.
As I would like to put both graphs together for comparison, it is desirable that both have the same scales.
Regards,
Camps
Offline
#4 2020-10-22 02:00:15
Re: << Graphs scale >>
Dear Camps,
Due to limitation of the graphical library employed by Multiwfn, the lengths of the two sides of gradient line map must be identical (Multiwfn automatically makes them identical if not). Therefore, you can only make size of the color-filled map identical to the gradient line map. To realize this, you should plot gradient line map first, after calculation and plotting, you can find information like the following on screen
X/Y/Z of origin of the plane:    2.91742  -7.81771   0.00000 Bohr
X/Y/Z of end of the plane:      -5.59154   8.59693   0.00000 Bohr
X/Y/Z of translation vector 1:  0.01986  0.06262  0.00000 Bohr, Norm:  0.06570
X/Y/Z of translation vector 2: -0.06262  0.01986  0.00000 Bohr, Norm:  0.06570
Then, plot color-filled map, when Multiwfn asks you to define the plane to be plotted, select "6: Input origin and translation vector", then input the information that can be found above:
2.91742 -7.81771 0.00000
0.01986 0.06262 0.00000
-0.06262 0.01986 0.00000
That's all.
Best regards,
Tian
Offline
#5 2020-10-23 18:08:17
- icamps
- Member
- Registered: 2018-05-17
- Posts: 33
Re: << Graphs scale >>
I got it!
Thank you.
Offline
Pages: 1


