Multiwfn forum
Multiwfn official website: http://sobereva.com/multiwfn. Multiwfn forum in Chinese: http://bbs.keinsci.com/wfn
You are not logged in.
- Topics: Active | Unanswered
Pages: 1
#1 2020-09-10 09:58:59
- may01dz
- Member
- Registered: 2018-07-17
- Posts: 58
Multiwfn STM image
Hello,
I respectfully request your assistance, to benefit from this experimental data (constant current mode, Tunneling current: 0.5 nA; bias voltage: 100 mV, scan rate: 40.7 Hz), to select the most appropriate Multiwfn sittings, to simulate the STM image.
HOMO=-3.872242 eV
LUMO=-3.903024 eV
HOMO-LUMO gap: -0.030782 eV
thank you in advance.
Last edited by may01dz (2020-09-10 11:15:04)
Offline
#2 2020-09-10 18:30:20

Re: Multiwfn STM image
In the STM plotting interface, you should:
Choose "1 Toggle mode of STM image" once to switch to constant current mode
Choose "2 Set bias voltage" and input 0.1
Then you can select option 0 to start calculation. For more information, please check Section 3.300.4 of Multiwfn manual for description and 4.300.4 for practical example.
Note that it is impossible to calculate absolute tunneling current, the STM simulation method employed by Multiwfn essentially calculates LDOS, which is proportional to tunneling current. Therefore, after STM calculation, you should choose "1 Visualize isosurface of current" option to enter the GUI to visualize LDOS and properly determine a proper isovalue, and then use "3 Calculate and visualize constant current STM image" to input the proper value to simulate two-dimension STM map.
Offline
#3 2020-12-31 19:29:35
- permanenputro
- Member
- Registered: 2020-12-31
- Posts: 18
Re: Multiwfn STM image
Dear Prof. Tian Lu
#How do I rotate scanning tunneling microscopy result visualization (such as optimized structure visualization) by using Multiwfn software?
The geometric structure was optimized using the DFT method in Gaussian 09 software. Meanwhile, the STM simulation was carried out using NWchem software.
I want the STM simulation visualization to be rotated so that the results match the visualization in the optimized structure. Finally, the interpretation can be more interesting to look at and read. The parameters used in the STM simulation are as follows
(a) the set of distance between the nuclei and the tip is 0.7 - 0.0 = 0.7 Angstrom
(b) the set of the bias voltage is -3 Volt
(c) the set of Z coordinate is 1.2 Angstrom
thanks, advanced
Figure STM simulation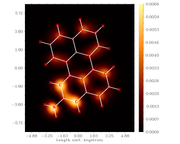
Figure optimized structure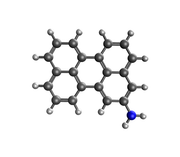
Offline
#4 2021-01-01 14:35:40
Re: Multiwfn STM image
Unfortunately, there is no way to directly rotate this map in Multiwfn. There are two solutions:
(1) Use image editor program to manually rotate selected region.
(2) Properly rotate the molecule using molecular geometry editor (e.g. GaussView, Avogadro, Gabedit...), so that the orientation of the molecule is appropriate with respect to Cartesian axis, and then perform a single point task to yield wavefunction file, then use Multiwfn to simulate STM map again.
Offline
#5 2021-01-01 17:22:14
- permanenputro
- Member
- Registered: 2020-12-31
- Posts: 18
Re: Multiwfn STM image
Dear Prof. Tian Lu
I have rotated the molecular structure using Avogadro, but when I look at the cartesian coordinates it is the same as in the molecular structure before it was rotated. Please help me, give me step-by-step (and screen-capture) so that I can understand it easily.
Thanks, Advanced
Offline
#6 2021-01-02 03:18:34
Offline
Pages: 1