Multiwfn forum
Multiwfn official website: http://sobereva.com/multiwfn. Multiwfn forum in Chinese: http://bbs.keinsci.com/wfn
You are not logged in.
- Topics: Active | Unanswered
#1 2020-05-09 21:49:41
- edulsa
- Member
- Registered: 2020-05-09
- Posts: 1
Trying to generate a Surface ElectroPotential Colored Map
Dear Developers and Users
It is my first entry in this forum so, I would like to thank Tian Lu for his efforts to create, maintain, and develop Multiwfn so good and useful as it has been.
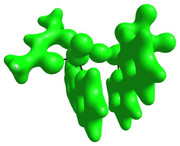
I could compute a Surface ElectroPotential using the 3.7 version without problems: it was a long time calculation (14 hours in my laptop), but I could finish it. When I asked to see the created surface (it was beautiful) but it was a one-color (greenish with some parts in slightly modified). I was expecting for a colored map (colors varying from dark blue until hot red, for negative and positive values), like is showed in several papers and textbooks. Please, could you point me what I did wrong or which must be my next steps to conclude this task? I mean, must I follow 4.A.13 example, using VMD as an "auxiliary" software?
I thank you in advance for your attention
My best regards
Eduardo
Offline
#2 2020-05-10 02:36:22
Re: Trying to generate a Surface ElectroPotential Colored Map
Multiwfn is only able to plot isosurface map, while in order to plot colored isosurface map, you have to make use of other visualization softwares. The VMD is best choice, it is really quite easy to use. Please follow this video tutorial, you will find it is never difficult:
Using Multiwfn and VMD to easily plot electrostatic potential colored molecular vdW surface map
https://youtu.be/QFpDf_GimA0
PS: If you are a Gaussian user, I strongly recommend to utilize cubegen to significantly accelerate calculation of ESP, as mentioned in Section 5.7 of Multiwfn manual.
Offline
