Multiwfn forum
Multiwfn official website: http://sobereva.com/multiwfn. Multiwfn forum in Chinese: http://bbs.keinsci.com/wfn
You are not logged in.
- Topics: Active | Unanswered
#1 2019-11-16 15:34:35
- CarmineV
- Member
- Registered: 2019-11-13
- Posts: 3
Plot difference map of electrostatic potential to study the binding
Hi,
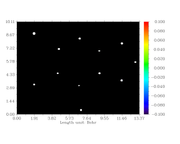
I have a problem when I plot the contour map of the electrostatic potential of my ligand in the pocket (imagine attached). Briefly, I would like to study the binding strength between the inhibitor and the protein active sites analyzing the electron density distribution and electrostatic potential maps. Although I do not have any problem to plot the electron density, I cannot achieve any good results using the electrostatic potential, I tried to change the scale, but still, I have a black image as output, any idea what is the problem? I am doing something wrong or it is the file calculation itself the problem? What else I can analyse to see a difference in the binding affinity of different ligands? For example the reduced density gradient? Just to give you some info, I have run two different jobs using gaussian: one just using the ligand alone (opt-b3lyp/6-31+g(d,p), the other using the lingad and few residues in the active site (ONIOM B3lyp: PM6). Thank you for your help.
Kind regards,
Carmine
Offline
#2 2019-11-16 17:18:58

Re: Plot difference map of electrostatic potential to study the binding
Dear Carmine,
I need more detailed information to figure out the reason.
Note that the fch file produced by Gaussian ONIOM task cannot be used as input file for wavefunction analysis purpose, because in this case the chk file doesn't contain any wavefunction information.
The fch file produced by opt-b3lyp/6-31+g(d,p) for ligand alone should work, if you are unable to plot the ESP plane map as illustrated in Section 4.4 of Multiwfn manual, please compress it and upload, and meantime show me all commands you inputted in Multiwfn (if the file is large even after compression, please send it to me via E-mail, the address can be found at the first page of Multiwfn manual)
Best regards,
Tian
Offline
#3 2019-11-18 10:02:35
- CarmineV
- Member
- Registered: 2019-11-13
- Posts: 3
Re: Plot difference map of electrostatic potential to study the binding
Dear Tian,
Thank you for your quick reply and your help. here the input file lines:
%nprocshared=32
%mem=30GB
%chk=active_site_ligand.chk
# oniom(b3lyp/6-31+g(d,p):pm6) scrf=(cpcm,solvent=water,oniompcm=x)
scf=qc geom=connectivity
STRUCTURAL PROTEIN
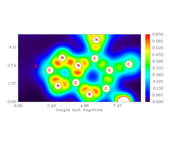
I have only recently started to use Multiwfn, I usually use gaussview to analyse my results and I can visualize the ESP surface using it, but I would like to use Multiwfn, because I found it more versatile. I can plot the contour line map, but I found it less clear than coloured one, and I don’t have any problem for electron density (imagines attached). Here the command that I used in Multiwfn:
4 // Plot graph in a plane
12 // Total electrostatic potential
2 // Draw contour line map (or 1//Colour-filled map)
120,120 // Number of grids in each direction
4//Define by three atoms
Thank again for your help.
Off topic: Could me clarify the option gradient norm of electron density? Which info I can extrapolate from it?
Regards,
Carmine
Last edited by CarmineV (2019-11-19 14:31:26)
Offline
#4 2019-11-18 14:46:31
Re: Plot difference map of electrostatic potential to study the binding
It seems that I need to more clarify the feature of the .chk file generated by ONIOM task of Gaussian.
For Gaussian, if ONIOM(H:L) keyword is used, where H and L correspond to the levels used for high layer and low layer, respectively, then the resulting .chk file only carries information of the real system (i.e. the whole system) calculated by L level. Therefore, if the L level is a molecular mechanics method, then the .chk file will not carry any wavefunction information; if the L level is a quantum chemistry method, the .chk file will contain MOs generated by this method. Because currently the L level you used is a semi-empirical level, while semi-empirical wavefunction is not supported by Multiwfn, therefore any wavefunction analysis result obtained based on your .chk file is completely meaningless or fully misleading.
If what you want to study is the electronic structure of the atoms at high layer, you should manually extract the high layer structure and then perform a single point calculation to generate .chk file, which can then be normally used for wavefunction analysis by Multiwfn.
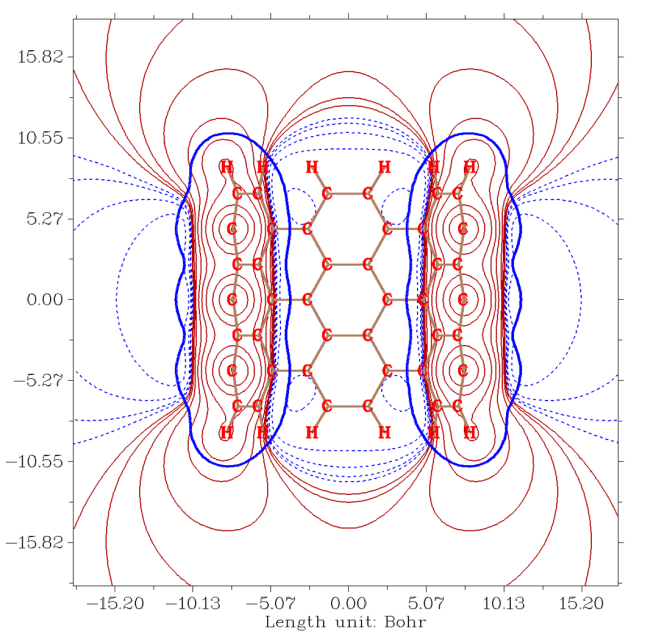
If you use correct input file and properly set the isovalues for the contour lines, the resulting map will be very informative, for example the ESP distribution in the slice plane of finite length of nanotube:
If you are familiar with AIM theory you will know that commonly there is a bond critical point (bcp) at each bonding region, which corresponds to the position with vanished gradient norm of electron density. Due to this reason, gradient norm of electron density has a certain ability to reveal bonding regions. However this is not popular, because for revealing bonding regions there are lots of more useful functions could be used, such as ELF, LOL, DORI, RDG, delta_g, valence electron density, Laplacian of electron density and so on, all of them are supported by Multiwfn.
Offline
#5 2019-11-19 14:30:58
- CarmineV
- Member
- Registered: 2019-11-13
- Posts: 3
Re: Plot difference map of electrostatic potential to study the binding
It seems that I need to more clarify the feature of the .chk file generated by ONIOM task of Gaussian.
For Gaussian, if ONIOM(H:L) keyword is used, where H and L correspond to the levels used for high layer and low layer, respectively, then the resulting .chk file only carries information of the real system (i.e. the whole system) calculated by L level. Therefore, if the L level is a molecular mechanics method, then the .chk file will not carry any wavefunction information; if the L level is a quantum chemistry method, the .chk file will contain MOs generated by this method. Because currently, the L level you used is a semi-empirical level, while semi-empirical wavefunction is not supported by Multiwfn, therefore any wavefunction analysis result obtained based on your .chk file is completely meaningless or fully misleading.
If what you want to study is the electronic structure of the atoms at high layer, you should manually extract the high layer structure and then perform a single point calculation to generate .chk file, which can then be normally used for wavefunction analysis by Multiwfn.
Thank you for the clarification about the .chk file, it is clear now and I will follow your suggestion. However, I have still some doubts if I can evaluate the influence of the residues involved in the binding extracting the high layer structure (ligand). I would try to study the non-covalent interaction between protein and ligand analysing the reduced-density-gradient, as you suggested. Thank you a lot again for your help.
Regards,
Carmine
Offline
#6 2019-11-19 16:18:05
Re: Plot difference map of electrostatic potential to study the binding
Dear Carmine,
You can manually extract a cluster, which contains the ligand as well as several residues that closely contact to the ligand, then properly add hydrogens at the truncated bonds to saturate them. After that, perform a single point calculation for the cluster to obtain wavefunction file, which can then be used to analyze non-covalent interaction by Multiwfn. Since most analysis methods in Multiwfn are not quite sensitive to the calculation level, you can use e.g. B3LYP/6-311G** (or even poorer level B3LYP/6-31G*) to conduct the calculation, in this case a single point task will not be quite time consuming even if the cluster consists of 100~200 atoms.
If you are not sure how to build the cluster model, I suggest you read this review: J. Am. Chem. Soc., 139, 6780 (2017), which presents several examples.
Best regards,
Tian
Offline