Multiwfn forum
Multiwfn official website: http://sobereva.com/multiwfn. Multiwfn forum in Chinese: http://bbs.keinsci.com/wfn
You are not logged in.
- Topics: Active | Unanswered
#1 2019-05-13 10:40:39
- bulat
- Member
- Registered: 2019-05-13
- Posts: 1
Plotting colored electron density surface
Hello,
I wanted to plot an electron density surface of my molecule based on the calculation results I get from Gaussian in the form of Test.FChk file.
If I understand correctly, the way to do it is load the file and consequently choose menu options 5 (Output and plot specific property within a spatial region (calc. grid data)), 1 (Electron density). Then select the quality and finally get the surface.
I wonder though if it is possible make the electron density surface colored with accordance to the electrostatic potential?
It is possible to get it done in Avogadro (see an example attached below). But the way Avogadro does it is not straightforward (for me) and it fails with some of my results. Perhaps Multiwfn could be more powerful?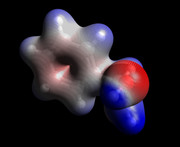
Best regards,
Bulat
Offline
#2 2019-05-14 12:51:08

Re: Plotting colored electron density surface
Dear Bulat,
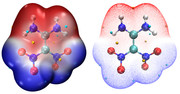
This map is often known as electrostatic potential mapped molecular surface map. Using Multiwfn with VMD (a famous free visualization software) to plot such kind of map is extremely easy, fast and the quality is quite satisfactory, and meantime extrema of ESP can be easily appended to the graph. I strongly suggest you read Section 4.A.13 of latest version of Multiwfn manual to check how plot it. Below is an example (click to enlarge)
Best regards,
Tian
Online