Multiwfn forum
Multiwfn official website: http://sobereva.com/multiwfn. Multiwfn forum in Chinese: http://bbs.keinsci.com/wfn
You are not logged in.
- Topics: Active | Unanswered
Pages: 1
#1 2025-11-20 07:01:16
- Ainosya
- Member
- Registered: 2024-12-06
- Posts: 15
Using Cube file
Hello,
I have generated my cube file with my own software, which follows Gaussian formatting. I would like to plot the electron density. Multiwfn loads my cube file correctly, but there is no option to print the electron density in the main menu 3.
How can I analyze my cube file to obtain the electron density along different directions (x, y, z) in 1D?
Thank you
Offline
#2 2025-11-20 19:03:36

Re: Using Cube file
You should set "iuserfunc" in settings.ini to -1 (linear interpolation) or -3 (B-spline interpolation), then when plotting line map in main function, select "100 User-defined function". In this case the function to be plotted corresponds to interpolated function from the loaded grid data.
Offline
#3 2025-11-20 20:24:46
- Ainosya
- Member
- Registered: 2024-12-06
- Posts: 15
Re: Using Cube file
Hello
Thank you.
It seems to work. However, if I load a file where the electron density is shifted—for example, along the x-axis to 3.5 Å—then loading the file and using:
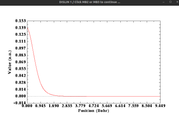
3 -> 100 -> 2 -> 3.5,0,0,3.5,5,0
(to plot the charge density along the y-axis) returns an empty plot.
For reference, the one which has the electron density on the center works fine with 3 -> 100 -> 2 -> 0,0,0,5,0,0 A
Offline
#4 2025-11-21 03:46:16
Re: Using Cube file
Please enter main function 0 and carefully check your atom coordinates. If the function on the line is zero everywhere, or the line is outside the spatial range of provided grid data, then the map cannot be generated.
Offline
Pages: 1