concvar: A computer program for simulation of concentration variation of complex chemical reactions
Latest version:1.0 (Release date: 2022-Jan-20 Last update: 2022-May-16)
Developer
Dr. Tian Lu (Contact: sobereva[at]sina.com. Beijing Kein Research Center for Natural Sciences, China)
If you encountered any difficulty in using concvar, or you have found bug, or you have any suggestion on improving concvar, please feel free to contact me!
Citation
If concvar is utilized in your work, the following paper should be cited in your article:
Tian Lu, Concvar: A computer program for simulating concentration variation of complex chemical reactions, ChemRxiv (2022) DOI: 10.26434/chemrxiv-2022-r6rh8-v2
Download
Manual: concvar_manual_1.0.pdf. Introduction of background theory, input file and many examples can be found in the manual.
Executable file: concvar_1.0.zip (including executable files of Windows and Linux platforms)
Introduction of concvar
介绍文章:《使用concvar程序求解复杂化学反应中物质的浓度随时间的变化》(http://sobereva.com/642)
What is concvar?
concvar is a program aiming at studying variation of concentration of various chemical substances over reaction time by numerically solving reaction kinetics equations. Linking relationship between substances and free energies of all minima and transition states in energy profile are needed as input. concvar is significant for both practical research and physical chemistry teaching.
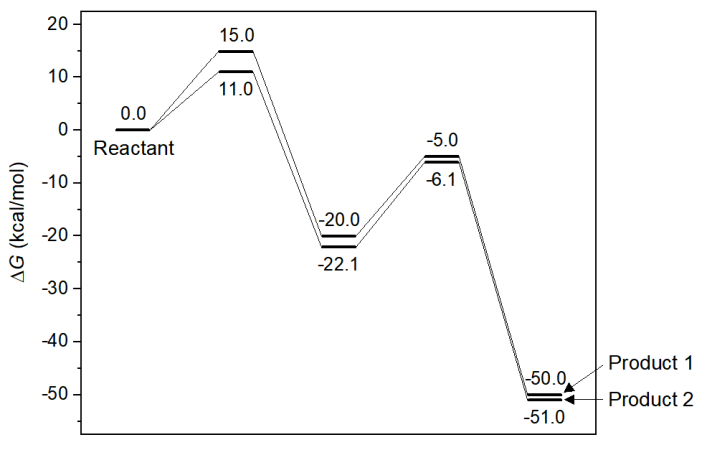
A complex chemical reaction consists of multiple elementary reactions, and there are multiple minima on potential energy surface, which correspond to various chemical substances. It is not only theoretical interesting, but also of great practical significance, to investigate how concentration of various minima change over reaction time. For example, in the following energy profile, there are two reaction paths from the reactant, which finally lead to two different products, which one is the major product at a given reaction condition? This is an important and frequently encountered problem in practice research, however the answer is not obvious. If one numerically simulates the change in concentration over time via concvar program, the results will be clear.
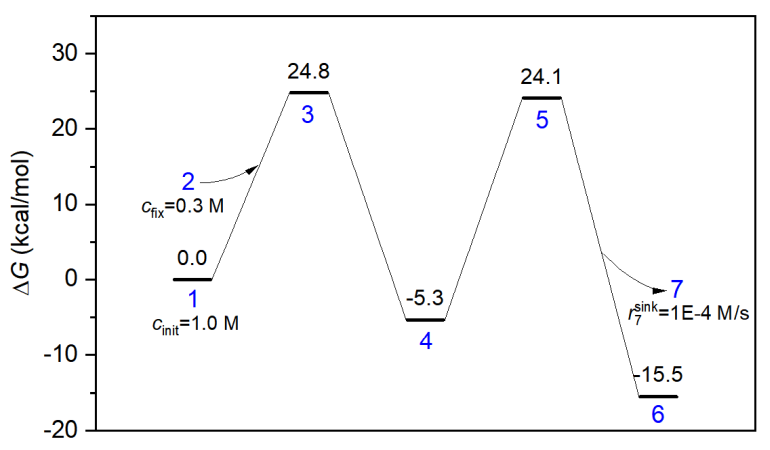
In concvar you can easily and flexibly define energy profile and status of a complex reaction. For example, as can be seen in the following map, the initial concentration of reactant is set to be 1.0 M, the concentration of adding molecule is fixed to be 0.3 M, and consumption rate of leaving molecule is set to be maximally 0.0001 M/s.
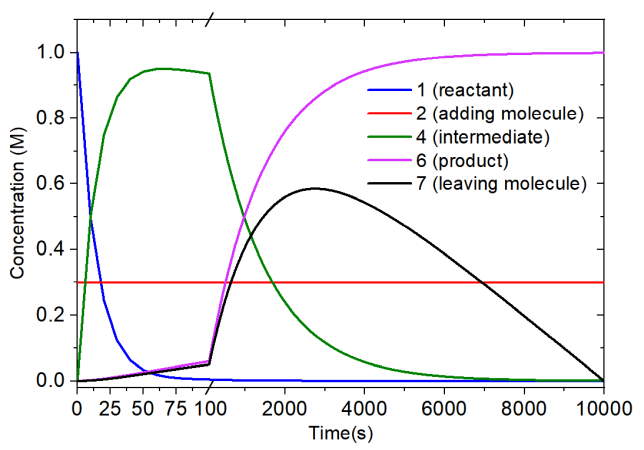
The concentration variation is outputted by concvar to a plain text file, you can then easily use e.g. Origin to plot variation curves. The following map corresponds to time-dependent concentrations produced by simulation of above reaction.
Features of concvar
- Input file is very convenient to manually create, and output information is very easy to understand
- Arbitrary number of minima and transition states can be defined
- Each minimum can connect arbitrary number of reaction paths
- Reaction rate constants can be manually set or automatically derived by transition state theory
- Rate of generation and consumption of any minimum can be defined
- Concentrations of minima can change spontaneously or be fixed at specific values
- Criterion of concentration for any minimum can be set to stop the simulation at the right time
- Boltzmann redistribution among specific minima can be conducted at every simulation step
- Both unimolecular and bimolecular elementary reactions can be included
Update History
2022-Jan-20: Initial release.