Multiwfn forum
Multiwfn official website: http://sobereva.com/multiwfn. Multiwfn forum in Chinese: http://bbs.keinsci.com/wfn
You are not logged in.
- Topics: Active | Unanswered
Pages: 1
#1 Multiwfn and wavefunction analysis » Task for NLO analysis » 2021-02-23 23:19:16
- permanenputro
- Replies: 1
Dear Prof. Tian Lu
Is the task for NLO analysis only in terms of the ground state (DFT) OR excited state (TDDFT)? When viewed in the Multiwfn module, the keyword used is POLAR in the ground state (DFT).
#NLO= nonlinear optic
Cheers,
Mono
#2 Re: Multiwfn and wavefunction analysis » RDG scatter map in IrfanView » 2021-02-23 21:51:16
Hello Prof. Tian Lu
I want to ask again, how to citing of GhostScript plugin in IrfanView? Because I've used it to visualize RDGscatter as post-processing.
Cheers,
Mono
#3 Re: Multiwfn and wavefunction analysis » RDG scatter map in IrfanView » 2021-02-23 08:57:46
I've been successful, thanks to Prof. Tian Lu.
Cheers,
Mono
#4 Multiwfn and wavefunction analysis » RDG scatter map in IrfanView » 2021-02-23 02:41:55
- permanenputro
- Replies: 5
Hello Prof. Tian Lu
I already have RDGscatter (in PS File format), which is obtained from Gnuplot. After that, I also installed GhostScript and IrfanView; But, I can't plot directly because it has to be configured in the "installed plugins". Please tell me, what should I "uncheck" so I can obtain the RDGscatter plot. (note. I don't have Photoshop and Acrobat Pro software).
Cheers,
Mono
#5 Re: Multiwfn and wavefunction analysis » charge transfer (CT) analysis » 2021-02-16 15:09:00
for the value of q_CT, usually, the report is whether it is a positive or negative part, Prof? or from a distance of positive and negative parts.
For example in this case;
(a) positive portion: 0.410
(b) negative portion: -0.410
(c) the distance of the positive and negative parts: 0.820
because reports in research journals provide no explanation; whether q_CT is used is the positive or negative part. Usually, they only provide the value q_CT (without telling the reader; whether they are using the positive or negative part of q_CT)
#6 Re: Multiwfn and wavefunction analysis » hole/electron transfer integral » 2021-02-16 14:36:14
Then, where can I find the hole / electron transfer integral used in Marcus's theory, Prof?
I've also asked about that at @ResearchGate. I really hope Prof. Tian Lu can help solve my problem?
#7 Multiwfn and wavefunction analysis » hole/electron transfer integral » 2021-02-15 13:58:51
- permanenputro
- Replies: 3
Dear Prof. Tian Lu
in this section on "Examining quantitative indices defined in the hole-electron analysis framework" pages 630-631 (as shown in Figure 1).
Is the value of "integral of electron and integral of hole" the value of "electron transfer integral (V_electron) and hole transfer integral(V_hole)"? in this case, I want to calculate V_hole / electron (as shown in Figure 2); and is used to calculate the charge transport rate as hole transport (k_hole) and electron transport (k_electron).
Cheers,
Mono
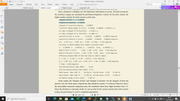
Figure 1
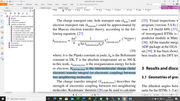
Figure 2
#8 Re: Multiwfn and wavefunction analysis » charge transfer (CT) analysis » 2021-02-15 13:37:23
Dear Prof. Tian Lu
I managed to get a charge transfer analysis. However, when I created the "electron density difference" grid, I tried to change the iso value to 0.005 (according to Prof. Tian Lu's suggestion in the manual book), and I tried to change it to 0.002. Finally, the EDD surface becomes larger when using the 0.002 iso value. Is it better if I use iso value 0.005 or 0.002 yeah sir?
I obtained the same charge transfer analysis on each of the previous EDD grids (0.005 and 0.002).
Besides that, where do I calculate the q_CT and d_CT values based on the charge transfer analysis output?
q_CT (positive and negative parts): 0.410 -0.410 a.u.
Barycenter of positive part in x,y,z (Angstrom): 0.091 0.665 0.001
Barycenter of negative part in x,y,z (Angstrom): 0.816 -0.474 -0.001
Distance of CT in x,y,z (Angstrom): 0.725 1.139 0.001 D index: 1.350
Dipole moment variation (a.u.) : 0.561 -0.882 -0.001 Norm: 1.045
Dipole moment variation (Debye): 1.426 -2.241 -0.002 Norm: 2.657
RMSD of positive part in x,y,z (Angstrom): 2.671 1.810 0.789 Total: 3.321
RMSD of negative part in x,y,z (Angstrom): 2.902 1.631 0.737 Total: 3.409
Difference between RMSD of positive and negative parts (Angstrom):
X: -0.231 Y: 0.179 Z: 0.052 delta_sigma index: -0.088
H_x: 2.786 H_y: 1.721 H_z: 0.763 H_CT: 2.084 H index: 3.365 Angstrom
t index: -0.734 Angstrom
Overlap integral between C+ and C- (i.e. S+- index): 0.934267
Thanks Prof.
#9 Re: Multiwfn and wavefunction analysis » charge transfer (CT) analysis » 2021-02-15 00:08:54
I tried again with DFT task ("#n B3LYP/6-31G(d,p) SP output=wfn") and TDDFT task ("# B3LYP/6-31G(d,p) TD(ROOT=1,SINGLET) density output=wfn"); But, I still haven't got the electron density difference.
#10 Re: Multiwfn and wavefunction analysis » charge transfer (CT) analysis » 2021-02-14 23:07:14
I'm so sorry Sir
I tried more, failed Sir. Below, my task in Gaussian 09
My task for calculation was:
For ground states:
(1) "#n B3LYP/6-31G(d,p) SP output=wfn"
(2) "#n B3LYP/6-31G(d,p) SP density output=wfn"
For excited states:
(1) "# B3LYP/6-31G(d,p) TD output=wfn"
(2) "# B3LYP/6-31G(d,p) TD(ROOT=1,SINGLET) output=wfn"
(3) "# B3LYP/6-31G(d,p) TD(ROOT=1,SINGLET) density output=wfn"
Why all my calculations, none of them work to get the electron density difference?
Please, help me, Sir
#11 Multiwfn and wavefunction analysis » charge transfer (CT) analysis » 2021-02-14 22:29:35
- permanenputro
- Replies: 8
Dear Prof. Tian Lu
in this section of "4.18.3 Analyze charge-transfer during electron excitation based on the electron density difference" on pages 658. How to task for obtained "extP2.wfn and basP2.wfn"?
I tried using several task, as "# B3LYP/6-31G(dp) TD output=wfn; #B3LYP/6-31G(dp) TD(ROOT=1,SINGLET) output=wfn" for excited states; and, I used task "#n B3LYP/6-31G(dp) SP output=wfn" for ground states; but, I obtained qCT value of 0 (zero).
Cheers,
Mono
#12 Multiwfn and wavefunction analysis » ESP colored molecular surface » 2021-01-16 00:24:43
- permanenputro
- Replies: 1
Dear Prof. Tian Lu
I have followed the tutorial to obtain an ESP map using the link below with the title "Plotting electrostatic potential colored molecular surface map with ESP surface extrema via Multiwfn and VMD", from stages 1 to 2. In stage 3, it is recommended to use Photoshop software; whereas, I don't have it. Can I get an ESP map (as shown below) without using Photoshop?. I also attached the 3 output files obtained by Multiwfn, as input files for VMD software.
#Link
http://sobereva.com/multiwfn/res/plotESPsurf.pdf
#Figure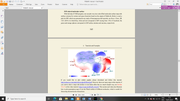
#google drive
https://drive.google.com/drive/folders/ … sp=sharing
Danke
#13 Re: Multiwfn and wavefunction analysis » Plotting fluorescence spectrum by Multiwfn » 2021-01-03 17:37:36
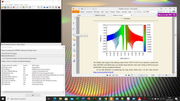
Are my findings for UV-Vis and fluorescence spectra (using the Kasha rules) correct?
Other than that,
Why is the Y-axis in the fluorescence spectrum the molar absorption coefficient? not absorbance
How can I find the pathlength and concentration values to convert the molar absorption coefficient to absorbance? my goal is to make the absorption spectrum [wavelength (nm) versus absorbance (a.u)]
Many thanks, Prof. Tian Lu
#14 Re: Multiwfn and wavefunction analysis » Plotting fluorescence spectrum by Multiwfn » 2021-01-03 16:52:33
Hello Prof. Tian Lu
I have found plots of UV-vis and fluorescence spectra using Multiwfn. However, when I observe it, does this approach always show the same fluorescence spectra as the UV-vis spectra in the first excitation states?
Please, give me some publications that have used the Kasha rules approach (using Multiwfn software) to simulate fluorescence with the same plotting spectra that I found?
Thanks, advanced
Figure UV-Vis spectra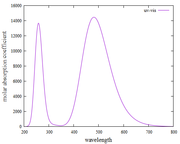
Figure Fluorescence spectra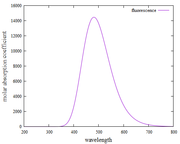
Figure UV-Vis and Fluorescence spectra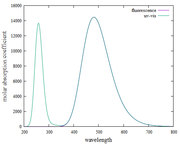
#15 Re: Multiwfn and wavefunction analysis » Multiwfn STM image » 2021-01-01 17:22:14
Dear Prof. Tian Lu
I have rotated the molecular structure using Avogadro, but when I look at the cartesian coordinates it is the same as in the molecular structure before it was rotated. Please help me, give me step-by-step (and screen-capture) so that I can understand it easily.
Thanks, Advanced
#16 Re: Multiwfn and wavefunction analysis » Plotting fluorescence spectrum by Multiwfn » 2021-01-01 16:32:32
Dear Prof. Tian Lu
I have done it again as suggested by Prof. Tian Lu. However, the fluorescence spectrum results are still the same as the absorption spectrum. Thank you, if I'm wrong, please correct me, it will be very helpful for me.
step-by-step I did visualize the fluorescence spectrum as follows
#1
#2
#3
#4
#5
#6
#7
#17 Re: Multiwfn and wavefunction analysis » Multiwfn STM image » 2020-12-31 19:29:35
Dear Prof. Tian Lu
#How do I rotate scanning tunneling microscopy result visualization (such as optimized structure visualization) by using Multiwfn software?
The geometric structure was optimized using the DFT method in Gaussian 09 software. Meanwhile, the STM simulation was carried out using NWchem software.
I want the STM simulation visualization to be rotated so that the results match the visualization in the optimized structure. Finally, the interpretation can be more interesting to look at and read. The parameters used in the STM simulation are as follows
(a) the set of distance between the nuclei and the tip is 0.7 - 0.0 = 0.7 Angstrom
(b) the set of the bias voltage is -3 Volt
(c) the set of Z coordinate is 1.2 Angstrom
thanks, advanced
Figure STM simulation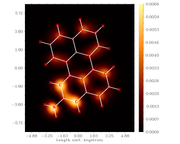
Figure optimized structure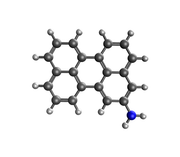
#18 Re: Multiwfn and wavefunction analysis » Plotting fluorescence spectrum by Multiwfn » 2020-12-31 19:03:05
I have tried plotting absorption spectra and fluorescence spectra based on what Prof. Tian Lu. Surprised, when I found the plot results and the XY file on the absorption and fluorescence spectra, they were the same and not different. please, point out my mistakes and give me step-by-step instructions or guides for plotting fluorescence spectra.
thank you, it will be very helpful for me.
Figure 1 absorption spectra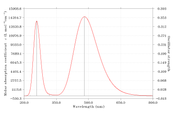
Figure 2 fluorescence spectra
Pages: 1