Multiwfn forum
Multiwfn official website: http://sobereva.com/multiwfn. Multiwfn forum in Chinese: http://bbs.keinsci.com/wfn
You are not logged in.
- Topics: Active | Unanswered
#1 Multiwfn and wavefunction analysis » WFX file from a modified MOLDEN file produced by MRCC » 2026-05-12 17:56:16
- prasanta13
- Replies: 1
Dear Prof. Lu,
I hope you are well. From the manual of Multiwfn, I can see that it is possible to convert a molden file and density matrices from MRCC to a wfx file, given that only spherical harmonics is used. I am trying something different, using cartesian density fitting basis functions to generate wfn/wfx file with different normalization. This is to be used for an internal code that we are developing and to run AIMAll.
I tried to get some inspiration from the Multiwfn source code on the orbital ordering (as MRCC does different orbital ordering than that of Gaussian) and normalizations process. So far, my python code does the orbital ordering right (or so I think) but it is not normalized properly.
Can you provide some help and/or point me towards a particular subroutine of the source code of Multiwfn that does the same?
Thanking you
Kind regards
Prasanta
P.S. If you require the wfx file that I have produced, I can share it with you.
#2 Re: Quantum Chemistry » Changes of density matrix between cartesian and spherical basis set » 2025-01-31 12:03:33
Thank you Prof. Tian. The problem lies there actually for using >= D basis functions. I also think that for each basis set and for each atom (say aug-cc-pVTZ with S atom) the orbitals and density matrices will be different. Can you shed some light if I have the orbitals/density matrices in spherical gaussian, can I transform them to cartesian versions?
Thanks,
Prasanta
#3 Quantum Chemistry » Changes of density matrix between cartesian and spherical basis set » 2025-01-30 17:23:26
- prasanta13
- Replies: 3
Hello Prof Tian,
There are two different types of basis sets, cartesian and spherical type. If the basis set has only p-type functions then they are the same. However, for d-type and f-type the components of the basis set are different. The d-functions for spherical are 5D and for cartesian are 6D.
For correlated calculation (CCSD) one can obtain the natural orbitals and create the .wfn file, 1PDM and 2PDM (after solving the lambda equations).
I want to ask,
What are the changes
1. in the natural orbitals
2. in the 1PDM (both in MO and AO basis)
3. in the 2PDM (both in MO and AO basis)
when one use Cartesian (or Spherical) basis rather than Spherical (or Cartesian) ones?
Thanks,
Prasanta
#4 Re: Quantum Chemistry » Same total energy with AIMAll with regular and self-consistent NL corr » 2025-01-12 12:27:39
Yes, this is true. I have checked the same as you suggested. At the intermolecular region, only a small amount of density increase is found. On the other hand, around the atoms, small amount of density is decreased. The threshold I set for the plot is 5e-5 unit.
#5 Re: Quantum Chemistry » Same total energy with AIMAll with regular and self-consistent NL corr » 2025-01-10 10:36:50
I agree on that part that it is a dispersion correction method. However, from the ORCA 6.0.1 manual, I find this,
"The use of the keywords !B3LYP SCNL would request a self-consistent treatment in
which orbitals and density are optimized in the presence of the full B3LYP + VV10 exchange-correlation potential."
Doesn't that mean that the .wfn file is also changed notably?
#6 Quantum Chemistry » Same total energy with AIMAll with regular and self-consistent NL corr » 2025-01-09 16:12:58
- prasanta13
- Replies: 4
Hello Prof Tian,
I have run a regular PBE and PBE SCNL calculation with ORCA and obtained the .wfx files from orca_2aim. Now, with the wfx files, I have run AIMAll and found that the AIMAll obtained energies are similar whereas energies obtained from ORCA are very different.
Here is the ORCA input with SCNL
! PBE SCNL VERYTIGHTSCF NORI AIM KEEPDENS
%maxcore 8000
%pal
nprocs 8
end
%method
IntAcc 7
end
%basis
Basis "aug-cc-pVTZ"
end
* xyzfile 0 1 mp2_opt_AVTZ.xyz
With energy = -381.7650100511 Hartree
And ran PBE calculation with the same input as above without "SCNL".
With energy = -381.952393605 Hartree
Now, with the obtained .wfx Files, I had to add
<Model>
PBE
</Model>
Which I did to both SCNL and non-SCNL .wfx files and ran AIMAll.
AIMAll gives total energy as,
PBE-SCNL = -381.952350
PBE = -381.952365
And both are relatively same.
So, does the SCNL keyword change the density? or it is the problem with AIMAll? Such that providing any .wfx files (even produced by M06) with <Model> as PBE will also give the same energy?
Thank you very much
Prasanta
#7 Re: Quantum Chemistry » Calculation of rho, grad(rho) and lap(rho) » 2024-11-10 08:58:26
Thank you Tian,
I will do as you said and get back to you if I face any problems.
Thanks again
Prasanta
#8 Quantum Chemistry » Calculation of rho, grad(rho) and lap(rho) » 2024-11-08 18:33:21
- prasanta13
- Replies: 2
Dear Tian,
I was looking at this paper, by Medvedev et al (Science 355, 49-52 (2017)) where they have compared the differences of rho, gradient and laplacian of rho for many atoms between CCSD(full), MP2, MP3 etc with many xc functionals. I was wondering if I can test the accuracy of some of the functionals suggested by them (B3LYP, PBE0 etc) by means of rho, grad and lap of rho for some molecules. I think I can calculate those values with Multiwfn, right?
Do I need any particular software, as ORCA, Gaussian for them.
How large integration grids in multiwfn is necessary?
Thank you very much
Prasanta
#9 Re: Quantum Chemistry » Calculate the one-particle and two-particle density matrix » 2023-10-09 11:44:08
Sorry for the late reply, I am incredibly sorry.
I have asked the PSI4 community to extract 2PDM at CCSD(T) level. However, I got nothing yet. Could you tell me how to obtain the 2PDM from the CCSD(T) calculation from PSI4 (preferred since I can access it) or Molpro.
Thanking You
Prasanta
#10 Re: Quantum Chemistry » Calculate the one-particle and two-particle density matrix » 2023-08-11 12:54:46
Many many thanks Prof Tian. I am working with PSI4, Lets see if I can find something.
#11 Quantum Chemistry » Calculate the one-particle and two-particle density matrix » 2023-08-09 12:07:22
- prasanta13
- Replies: 4
Hi Prof Tian,
I am trying to obtain the HF and CCSD(T) one and two-particle density matrix from the respective wavefunction (like HF or Correlated). I can do this using PySCF, but it takes a lot of memory (1TB for ~200 basis functions for CCSD(T)). This is why I tried to do it with other programs like Psi4 or ORCA which are less memory hungry. However, I do not know how to obtain the DM from wfn file. Note: I am using a custom basis functions.
Thanks
Prasanta
#12 Re: Multiwfn and wavefunction analysis » Export MO cube file from gbw or fch file » 2022-08-22 05:31:55
Thank you, Prof. TIan. It works.....
#13 Re: Multiwfn and wavefunction analysis » Export MO cube file from gbw or fch file » 2022-08-21 13:21:35
Prof. Tian, In case someone wants to do the same thing you mentioned in the 2nd point of your answer, the manual is not clear (v3.8). I want a set of orbitals suppose homo, lumo, homo+-2 and lumo+-2 into different cube files. how can one proceed?
#14 Re: Multiwfn and wavefunction analysis » TD-DFT transition probabilities from ORCA output » 2022-08-16 06:22:05
Thank You Prof. Tian...
#15 Re: Multiwfn and wavefunction analysis » TD-DFT transition probabilities from ORCA output » 2022-08-13 05:13:59
Thank you, Professor Tian. I get that part. Can you please tell me what the following means?
139a -> 141a : 0.380347 (c= -0.61672301)
orb pairs config coeff ??
I get orbital pairs, but the next two numbers bothers me. What are these?
#16 Multiwfn and wavefunction analysis » TD-DFT transition probabilities from ORCA output » 2022-08-12 07:33:11
- prasanta13
- Replies: 4
Dear Prof Tian,
I have performed vertical excitation using ORCA (default setting) with RSH/def2-TZVP.
The output is this, (only printing interesting texts)
STATE 1: E= 0.085477 au 2.326 eV 18760.0 cm**-1 <S**2> = 0.000000
139a -> 141a : 0.380347 (c= -0.61672301)
139a -> 142a : 0.021636 (c= -0.14709245)
139a -> 144a : 0.029537 (c= 0.17186373)
140a -> 141a : 0.493712 (c= -0.70264618)
140a -> 142a : 0.021983 (c= -0.14826775)
140a -> 144a : 0.030323 (c= 0.17413609)
STATE 2: E= 0.085954 au 2.339 eV 18864.8 cm**-1 <S**2> = 0.000000
139a -> 141a : 0.493490 (c= 0.70248856)
139a -> 142a : 0.022278 (c= -0.14925782)
139a -> 144a : 0.027986 (c= 0.16728926)
140a -> 141a : 0.380403 (c= -0.61676836)
140a -> 142a : 0.021947 (c= 0.14814422)
140a -> 144a : 0.027699 (c= -0.16642982)
STATE 3: E= 0.132745 au 3.612 eV 29134.1 cm**-1 <S**2> = 0.000000
139a -> 142a : 0.123433 (c= 0.35133024)
139a -> 143a : 0.221706 (c= -0.47085677)
139a -> 144a : 0.117215 (c= 0.34236621)
139a -> 146a : 0.039887 (c= -0.19971670)
140a -> 142a : 0.072587 (c= -0.26941893)
140a -> 143a : 0.269701 (c= 0.51932752)
140a -> 144a : 0.061824 (c= -0.24864433)
140a -> 146a : 0.039400 (c= 0.19849355)
STATE 4: E= 0.133335 au 3.628 eV 29263.6 cm**-1 <S**2> = 0.000000
137a -> 145a : 0.011128 (c= 0.10548751)
139a -> 142a : 0.086160 (c= 0.29353050)
139a -> 143a : 0.212033 (c= 0.46047060)
139a -> 144a : 0.140644 (c= 0.37502547)
140a -> 142a : 0.142376 (c= 0.37732800)
140a -> 143a : 0.156057 (c= 0.39504032)
140a -> 144a : 0.211858 (c= 0.46028051)
When I try to calculate the transition probabilities, it doesn't give back 100%. The system is a closed shell. Any suggestion? or can it be done in Multiwfn? I tried to plot the Uv-vis spectra and see the transitions by this.
Multiwfn sp.out > 11 > 3 > 15 > 0 > 533.04910
What I get,
Sum of absolute values of all transitions: 41.19493
The individual terms are ranked by magnitude of contribution:
#Transition Contribution %
2 36.69845 89.085
1 4.34905 10.557
3 0.12731 0.309
7 0.01532 0.037
4 0.00242 0.006
8 0.00215 0.005
6 0.00015 0.000
5 0.00007 0.000
9 0.00000 0.000
10 0.00000 0.000
How does it calculate the transition percentage?
#17 Re: Multiwfn and wavefunction analysis » Export MO cube file from gbw or fch file » 2022-08-12 07:24:54
Thank you Prof. Tian.
#18 Multiwfn and wavefunction analysis » Export MO cube file from gbw or fch file » 2022-08-11 06:28:51
- prasanta13
- Replies: 5
Hi there,
I was wondering if there is a way to export MO cube files using Multiwfn.
We can visualize the HOMO, LUMO etc, but can we export the cube files?
#19 Re: Multiwfn and wavefunction analysis » Electron density xyz-type output problem » 2022-07-05 04:21:25
Okay, got it.
Thank You, Prof Tian.
#20 Multiwfn and wavefunction analysis » Electron density xyz-type output problem » 2022-07-04 11:21:01
- prasanta13
- Replies: 2
Hi Prof Tian,
For testing purposes, I have calculated a single-point (Hartree Fock) calculation on H2 molecule with ORCA and PSI4, followed by reading the .gbw and .fchk file by Multiwfn and exporting electron density to a .txt file with the high grid.
The steps I have taken are as follows.
Multwfn H2.gbw(or H2.fchk) > 5 > 1 > 3 >3
To integrate the electron density, I wrote a small python code which shows the total value of density as 0.28, which should be 2 (for H2). There can be some problems with my program, but when I cross-checked the data, I observed that the 4th column (density value) has only one maxima. Maxima value I obtained is 0.429159635 (from my program) and by using grep "4.291596" output.txt I got only one value "4.29159635E-001".
For H2 molecule, there should be two equal maximum values of density, right?
What could get wrong, any idea?
#21 Re: Multiwfn and wavefunction analysis » Hirshfeld partition of molecular density » 2022-06-17 14:00:30
Thank You Prof. Tian. It works, I am now analyzing the output.
#22 Re: Multiwfn and wavefunction analysis » Hirshfeld partition of molecular density » 2022-06-10 10:32:12
Yes
Main Menu > 5 > 1 > 3 > 3
#23 Re: Multiwfn and wavefunction analysis » Hirshfeld partition of molecular density » 2022-06-10 06:18:36
I am sorry for this misunderstanding Prof. Tian.
What I want to do, for example,
1. Take a molecule, suppose CH2Cl2 , calculate total density > export as 4 column txt file (done via multiwfn)
2. Now I want the density of CH2 and Cl2 separately and export density of CH2 and Cl2 as 4 column txt file.
Since Hirshfeld (or iterative) partitions works well for obtaining atomic densities from a molecule, in a similar fashion, can I get fragment densities as well?
Thank you Prof. Tian for your kind help.
#24 Multiwfn and wavefunction analysis » Hirshfeld partition of molecular density » 2022-06-09 06:32:12
- prasanta13
- Replies: 6
Hi Prof Tian,
I want to partition the total molecular density into small fragment densities based on Hirshfeld method. After that, I need those densities to be outputted as four column .txt file.
Can it be done in Multiwfn?
Thanks and Regards,
Prasanta
#25 Multiwfn and wavefunction analysis » Multiple Feature Request » 2021-09-08 04:44:59
- prasanta13
- Replies: 1
Dear Developers,
1. In many of the analysis, such as ESP, NCI etc etc, we go deeper into the Multiwfn submenu and can't view the molecule. Some time it becomes necessary to view the molecule the in the same way as Main Menu > 0. Can this be allowed?
2. If by any means, the x, y, z- axis can be shown with the e Density or ESP contour or in a similar types of plots.
#26 Re: Multiwfn and wavefunction analysis » ETS-NOCV has been supported in Multiwfn! » 2021-09-07 06:32:51
Many many thanks.
#27 Re: Multiwfn and wavefunction analysis » ESP Plot not covered fully inside the area » 2021-09-07 06:28:03
Prof Tian, I have used three points to define the plane. I took the liberty to select three points to define such a plane that gives me the maximum atoms to be shown.
By the way, Can this plot be extracted to a script like matplotlib or gnuplot such that one can tweek through the setting?
#28 Multiwfn and wavefunction analysis » ESP Plot not covered fully inside the area » 2021-09-03 10:42:14
- prasanta13
- Replies: 3
Hi there, I tried to plot the ESP contour diagram of a molecule. It is not fitted inside the default print area. Let me show by this image.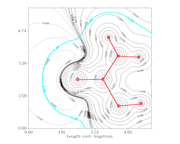
Are there an method by which I can fit the image inside the rectangle? Or can I increase the size of the rectangle?
#29 Multiwfn and wavefunction analysis » Condensed to atom Fukui Function for pi-holes » 2020-11-22 04:58:00
- prasanta13
- Replies: 1
Dear Users and Prof Tian,
For non-covalent interactions (especially the halogen bonding), the sigma-hole is the LEwis acid region, which can also be observed from the Fukui function for nucleophilic attack (f+). Its condensed to atom variant (fk+) can also be calculated from Multiwfn. However, is it possible to calculated the fk+ for the pi-holes or delta-holes?
#30 Re: Multiwfn and wavefunction analysis » error forrtl: severe (174): SIGSEGV, segmentation fault » 2020-09-06 13:26:15
Dear Tian, I am also facing same problem. I was using the 3.7 dev version and changed to stable one but the problem persists when using the .gbw file (since the wfn file do not contain the basis information, as stated by Multiwfn).
The error is as followed, when utilizing "4.2.4 Decompose properties at a critical point as orbital contributions" on the manual.
Calculating atomic contributions to orbitals by Hirshfeld method...
forrtl: severe (174): SIGSEGV, segmentation fault occurred
forrtl: severe (174): SIGSEGV, segmentation fault occurred
forrtl: severe (174): SIGSEGV, segmentation fault occurred
I am using Ubuntu 18.04
The bash section is as followed
#Multiwfn
export KMP_STACKSIZE=20000000000
export Multiwfnpath=/home/prasanta/Multiwfn/Multiwfn_3.7_bin_Linux/
export PATH=$PATH:/home/prasanta/Multiwfn/Multiwfn_3.7_bin_Linux/
ulimit -s unlimited
It also sourced properly.
What could be the problem?
Thanks in advance...