Multiwfn forum
Multiwfn official website: http://sobereva.com/multiwfn. Multiwfn forum in Chinese: http://bbs.keinsci.com/wfn
You are not logged in.
- Topics: Active | Unanswered
Pages: 1
#1 Re: Multiwfn and wavefunction analysis » Confusion between isosurface values and LUMO+x levels » 2026-01-16 07:59:02
Thanks sobereva, that cleared up the isosurface confusion.
I played around with the functions in 4, I have following findings
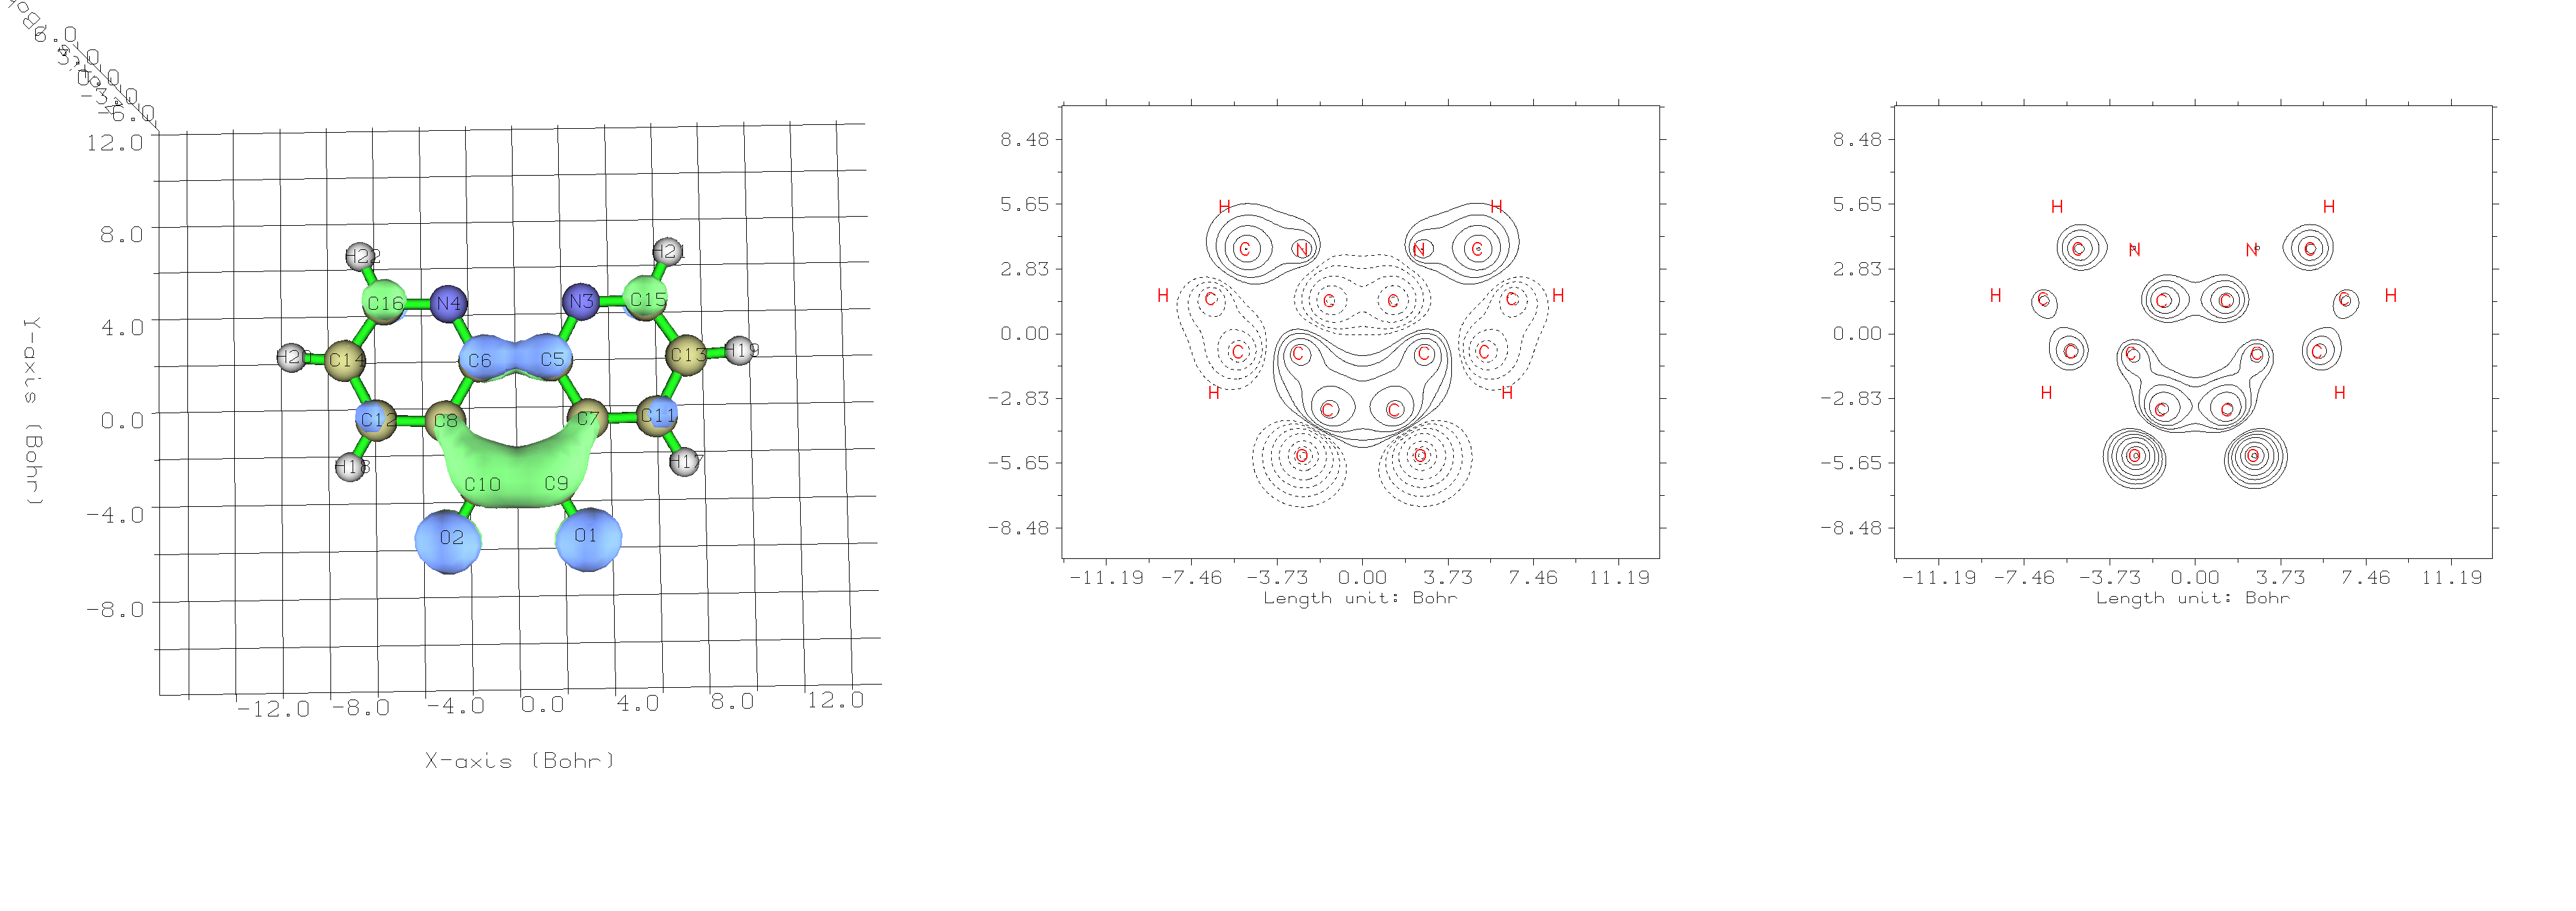
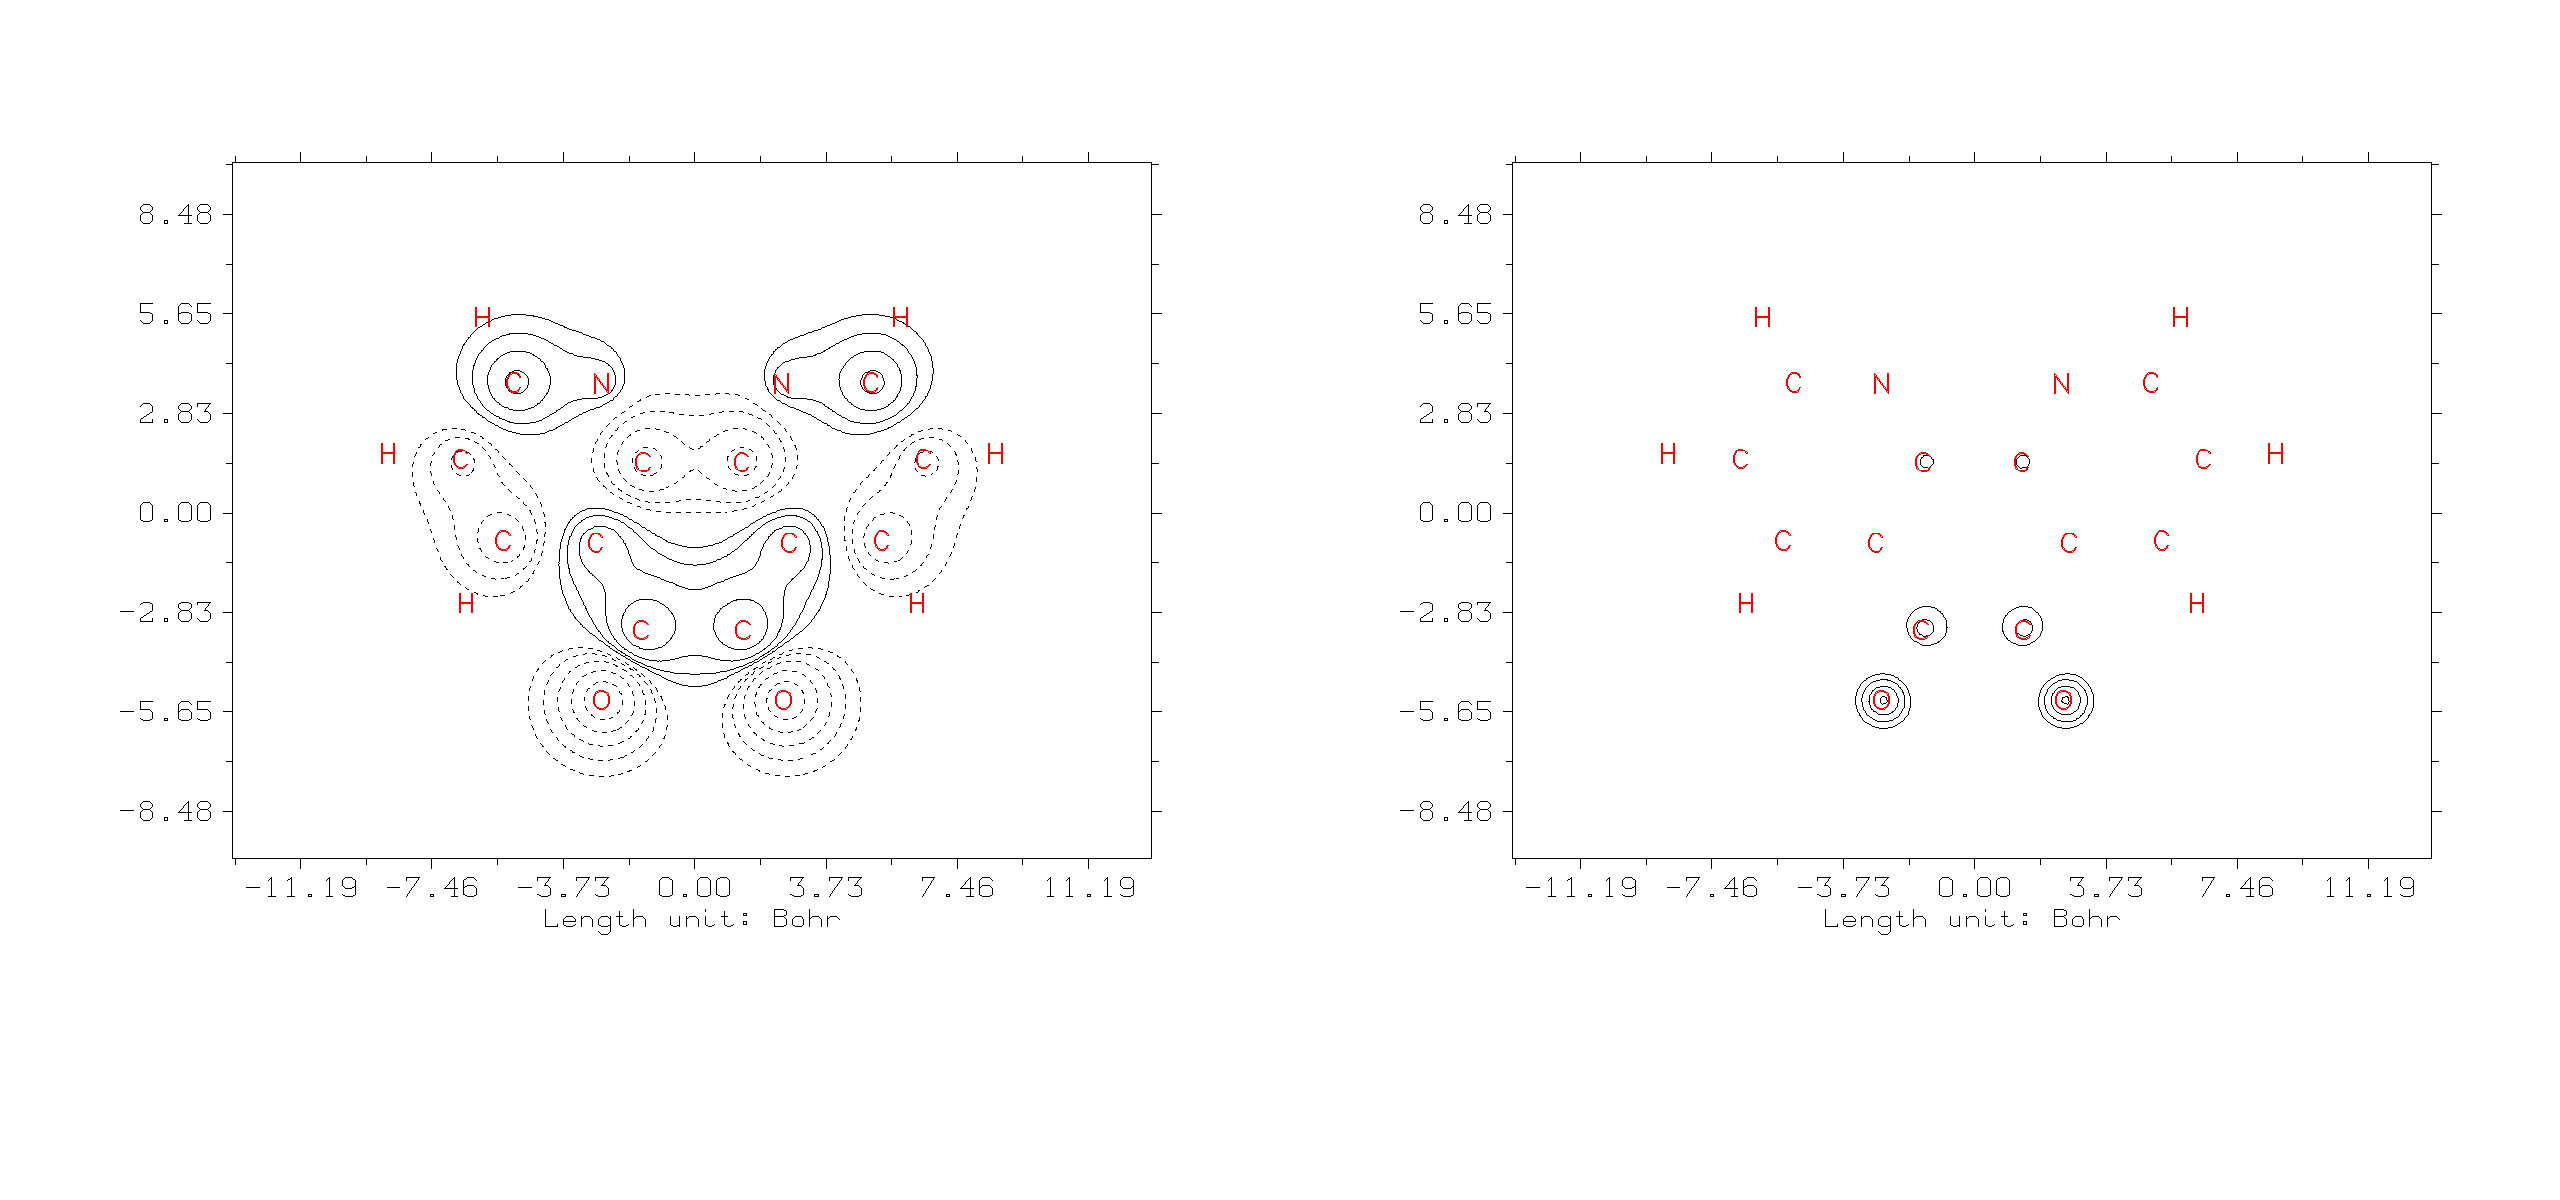
First image is the LUMO plot from function 0, second is from 4 -> 4 (Value of Orbital wave-function) and last one is 4 -> 44 (Orbital probability density).
As you can see, the probability density plot is the one that matches the contour projections. (both are plotted in xy-plane with Z=0.5bohr). I have also tested the "Special in-built function" in the plotting menu, ie.
# 3 Change setting of contour lines
# 5 Use built-in contour
# 3 For plotting orbital wavefunction
It seems to me, it just changed the value of Z. Is this the intended use case?
Thanks,
For clarification, I'm running these Multiwfn 3.8 on *Linux machine.
#2 Multiwfn and wavefunction analysis » Confusion between isosurface values and LUMO+x levels » 2026-01-15 16:22:32
- hisacro
- Replies: 3
Hello,
I'm trying to contour plot the projections of the orbitals LUMO to LUMO+10. I looked up the manual section 3.5, especially the contour line maps. In this plot there is only option for contour values, I believe this is isosurface values but how this translates to LUMO levels?. I also get a message on the console when plotting, 'LUMO+9 levels' are omitted to save memory.
I think I'm missing something really fundamental inregards to understanding. In the end I want to plot the projections of 10 levels starting from LUMO but I couldn't find the options.
Thanks.
I'm running version 3.8 Multiwfn
Pages: 1