Multiwfn forum
Multiwfn official website: http://sobereva.com/multiwfn. Multiwfn forum in Chinese: http://bbs.keinsci.com/wfn
You are not logged in.
- Topics: Active | Unanswered
Pages: 1
#1 Re: Quantum Chemistry » CP2K GAPW method failed to converge with all electron basis » 2026-04-30 02:20:58
Here are the relevant input and output files
problem.zip
#2 Quantum Chemistry » CP2K GAPW method failed to converge with all electron basis » 2026-04-30 02:16:14
- Hengyuan
- Replies: 2
Hello everyone,
I recently tried to calculate the XPS binding energy of some O atoms on a Pt surface using CP2K. I used a big all electron basis for the interested O atoms, a smaller all electron basis for other O atoms, and GTH-MOLOPT basis for Pt with pseudopotential. However, the SCF calculation could not converge. I then tried the ground state calculation with a similar GAPW method and GPW method. For GAPW method, the SCF convergence also failed, and gave me an absurd energy. The GPW method converged after about 100 steps. Strangely, both calculations showed warnings about Fermi-Dirac smearing, although I used METHFESSEL_PAXTON smearing and 1000 ADDED_MO. Any idea on this issue? Any suggestions would be appreciated. Thank you.
Best regards,
Hengyuan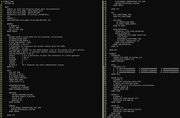
#3 Re: Multiwfn and wavefunction analysis » Plot electron density difference contour with cube file » 2025-09-25 21:28:03
Thank you! This is exactly the feature I want.
#4 Multiwfn and wavefunction analysis » Plot electron density difference contour with cube file » 2025-09-18 05:18:34
- Hengyuan
- Replies: 2
Dear Tian,
I tried to plot the density difference contour between a SCF converged water dimer and the two separate water molecules. Following your example 4.5.5 in the manual, I was able to generate the desired 2D contour plot using water-dimer.fchk - water1.fchk - water2.fchk. However, when I tried with cube file input, I couldn't get any 2D contour result. I also tried to generate the cube file with difference density, but after choosing plot planes, I got
4
-10 Return to main menu
-2 Obtain of deformation property
-1 Obtain of promolecule property
0 Set custom operation
----------- Avaliable real space functions -----------
1 Promolecular electron density
8 Electrostatic potential from nuclear charges
14 Reduced density gradient (RDG) with promolecular approximation
16 Sign(lambda2)*rho with promolecular approximation
22 Delta_g (promol. approx.)
100 User-defined real space function, iuserfunc= 0
1
and the plotted 2D contour is that of water dimer instead of difference density. Is this function simply not available with cube type files? If it supports cube files, what should I do to print 2D contour? Thank you.
#5 Re: Multiwfn and wavefunction analysis » Plot electron density along a line with fixed atom positions » 2025-09-17 18:10:21
Dear Tian,
Thank you for your reply. I should have chosen "Input coordinate of two points to define a line", or set the extension distance to 0 before using "Input index of two atoms to define a line". Thank you again for your help.
#6 Multiwfn and wavefunction analysis » Plot electron density along a line with fixed atom positions » 2025-09-17 04:30:31
- Hengyuan
- Replies: 2
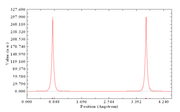
Dear Tian,
I am trying to plot the electron density of a water dimer along the O-O bond. The geometry of this is as follows in Q-Chem input format with unit in Angstrom:
$molecule
0 1
--
0 1
O 0.000000 0.000000 0.000000
H 0.480763 -0.756792 -0.334637
H 0.480763 0.756792 -0.334637
--
0 1
O 0.000000 0.000000 2.900000
H -0.899690 0.000000 3.225430
H -0.089397 0.000000 1.947180
$end
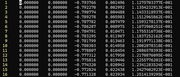
I was able to generate the line density along the O-O bond with Multiwfn, however, it seems like the molecule was shifted so the nuclei aren't in the initial position as input. I was able to confirm this conjecture by comparing the z coordinate and the X position in the curve graph in the saved line.txt file. Is there a way to fix the position of the molecule when generating the line density plot? Thank you in advance for your time!
Pages: 1