Multiwfn forum
Multiwfn official website: http://sobereva.com/multiwfn. Multiwfn forum in Chinese: http://bbs.keinsci.com/wfn
You are not logged in.
- Topics: Active | Unanswered
Pages: 1
#1 Re: Multiwfn and wavefunction analysis » ESP Scale Change » 2026-06-21 19:32:15
Dr Tian,
Thank you for this helpful comment.
Best wishes,
Alex
#2 Multiwfn and wavefunction analysis » ESP Scale Change » 2026-06-20 16:04:09
- alexlester1996
- Replies: 2
Dear Dr. Tian,
I've encountered an issue with creating an appropriate color bar scale for ESP in the VMD program.
Initially, the ESPiso.bat file was used for the 1.fch file to create the ESP1.cub + density.cub files. Then, the ESPiso.vmd script was utilized to generate the colored plot (as shown on the first screenshot). So, the result is as expected.
However, when I included the color bar via VMD, the value of the upper and lower limits was expressed in a.u. To convert it to more suitable "kcal/mol" values, I opened the ESPiso.vmd script that contains the following lines:
#Lower and upper limit of color scale of ESP (a.u.)
set colorlow -0.03
set colorhigh 0.03
and changed the respective values of the limits to -50 and 50 manually, as in the ESPpt.vmd script:
#Lower and upper limit of color scale of ESP (kcal/mol in most case)
set colorlow -50
set colorhigh 50
After this action, the gray transparent surface was generated. I understand that discoloration of the MEP surface is caused by changing upper and lower limits values while the resulting estimation of the limits is still expressed in a.u. (in other words, the program "sees" -50/50 a.u. instead of -50/50 kcal/mol).
I've analyzed your video tutorial on YouTube, where the following statement is present (on the second screenshot). But I don't clearly understand how to fix it manually (perhaps, it can be done using .bat files..) without external software like Photoshop.
So, I would highly appreciate your help.
Best regards,
Alex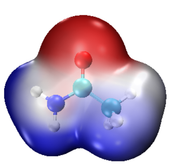

#3 Re: Multiwfn and wavefunction analysis » MESP Scan » 2026-05-27 03:40:05
Dear Professor Tian,
I am very grateful to you for your help!
Best regards,
Alex
#4 Re: Multiwfn and wavefunction analysis » MESP Scan » 2026-05-26 22:00:35
Dear Professor Tian,
Thank you for the quick answer! I also wonder, is it possible to plot the second map (or even the first) using the main function 13 (Process grid data), so I would be grateful for your professional feedback
Best wishes,
Alex
#5 Multiwfn and wavefunction analysis » MESP Scan » 2026-05-26 04:29:23
- alexlester1996
- Replies: 4
Dear Professor Tian,
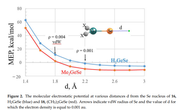
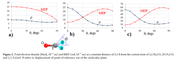
I'm not sure that is the correct description of the topic, but I will try to explain. Recently, I've found in some works these graphs. As I understand, they corresponds to the dependence of MEPS value from chosen distance or angle, which implies the scan of MESP in some manner
So, the main question is how this kind of analysis can be performed technically using MultiWFN software.
Thank you for your help
Pages: 1